 Overcoming Network Bottlenecks: Enterprise Configuration Manual for Inspecting Memory Leak Trends Using Built-in Performance Monitors
23 Oct, 2026. Posted by:XPONSHOP
Most Views Posts
Overcoming Network Bottlenecks: Enterprise Configuration Manual for how to configure VLAN trunking on core router
2026-06-05 16:50:20
The Ultimate Guide to 24 port PoE switch wholesale: Architecture, Backplane Bandwidth, and Deployment
2026-05-21 15:35:40
The Ultimate Guide to Choosing the Right Transceivers for 100G Switch Ports: Architecture, Backplane Bandwidth, and Deployment
2026-07-31 10:11:53
Troubleshooting Huawei MA5800 OLT: Rogue ONU Error, Optical Interfaces & Stacking Errors FAQ
2026-07-30 10:36:10
IP Address Conflict FAQ: Expert Answers for ONT Home Networks
2026-08-13 11:39:25
Popular Posts
Managing ONT: Initial Setup, Console Connection & Firmware Upgrades FAQ
2026-10-10 10:37:36
High-Density Fiber Infrastructure Application Note: OEM 1U Rackmount Optical Splitter Module Mechanical Frame Engineering Guide
2026-09-07 10:35:34
Carrier-Grade Routing Solution Brief: Deploying surge protection 6KV port isolation
2026-06-01 17:12:10
Hardening Enterprise Infrastructure: MACsec Integration and ACL Capabilities of Edge Gateway Routers
2026-06-22 15:32:24
Troubleshooting QoS for VoIP on ONT: VLAN, DSCP & Priority Queue FAQ
2026-10-12 10:55:38
Random Posts
OEM SFP Compatibility FAQ: Transceiver Alarms, Thermal Monitoring & Switch NMS Integration
2026-08-21 10:32:48
sFlow Network Monitoring FAQ: Expert Answers to Throughput, Configuration & Compatibility Questions
2026-06-08 15:52:04
XPONSHOP OEM Dual-Fiber Bidirectional SFP Transceiver Laser Operating Currents - Official Technical Overview & Hardware Datasheet
2026-07-31 10:25:36
Recent Posts
AI Optical Transceivers vs. Telecom Optical Transceivers: Two ‘Personalities’ of the Same Component
2026-10-30 11:30:33
Overcoming Network Bottlenecks: Enterprise Configuration Manual for Nintendo Switch NAT Type D Resolution
2026-10-30 10:06:06
Cisco Business 350 Series Managed Switch Physical Security and Power Efficiency - Official Technical Overview & Hardware Datasheet
2026-10-30 10:03:46
About
XponShop blog describes some basics for Huawei / ZTE /
Nokia / FiberHome GPON OLT, ONT, SFP, and Site Power...
such as configurations, issue troubleshooting, knowledge
sharing, and keeps updating.
Recent posts
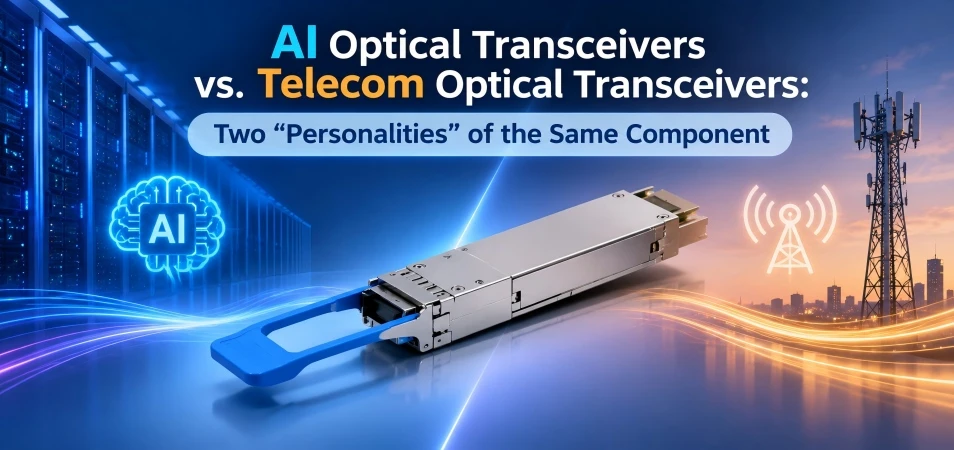 AI Optical Transceivers vs. Telecom Optical Transceivers: Two ‘Personalities’ of the Same Component
27 Mar, 2025
 Overcoming Network Bottlenecks: Enterprise Configuration Manual for Nintendo Switch NAT Type D Resolution
27 Mar, 2025
 Cisco Business 350 Series Managed Switch Physical Security and Power Efficiency - Official Technical Overview & Hardware Datasheet
27 Mar, 2025
AI Optical Transceivers vs. Telecom Optical Transceivers: Two ‘Personalities’ of the Same Component
27 Mar, 2025
Overcoming Network Bottlenecks: Enterprise Configuration Manual for Nintendo Switch NAT Type D Resolution
27 Mar, 2025
Cisco Business 350 Series Managed Switch Physical Security and Power Efficiency - Official Technical Overview & Hardware Datasheet
27 Mar, 2025
Products from the blog
基本
文件
流程
错误
SQL
调试
- 请求信息 : 2026-11-04 15:17:40 HTTP/2.0 GET : https://www.xponshop.com/blog/overcoming-network-bottlenecks-enterprise-configuration-manual-for-inspecting-memory-leak-trends-using-built-in-performance-monitors.html
- 运行时间 : 0.186718s [ 吞吐率:5.36req/s ] 内存消耗:1,352.34kb 文件加载:171
- 查询信息 : 0 queries
- 缓存信息 : 0 reads,0 writes
- 会话信息 : SESSION_ID=84b4c1249c4db79f2838fad5c565e22e
- /www/wwwroot/xpshop/public/index.php ( 2.34 KB )
- /www/wwwroot/xpshop/vendor/autoload.php ( 0.78 KB )
- /www/wwwroot/xpshop/vendor/composer/autoload_real.php ( 1.68 KB )
- /www/wwwroot/xpshop/vendor/composer/platform_check.php ( 1.04 KB )
- /www/wwwroot/xpshop/vendor/composer/ClassLoader.php ( 15.99 KB )
- /www/wwwroot/xpshop/vendor/composer/autoload_static.php ( 15.70 KB )
- /www/wwwroot/xpshop/vendor/topthink/think-helper/src/helper.php ( 8.64 KB )
- /www/wwwroot/xpshop/vendor/topthink/think-orm/stubs/load_stubs.php ( 0.17 KB )
- /www/wwwroot/xpshop/vendor/topthink/framework/src/think/Exception.php ( 1.75 KB )
- /www/wwwroot/xpshop/vendor/topthink/framework/src/think/Facade.php ( 2.81 KB )
- /www/wwwroot/xpshop/vendor/symfony/polyfill-mbstring/bootstrap.php ( 8.43 KB )
- /www/wwwroot/xpshop/vendor/symfony/polyfill-mbstring/bootstrap80.php ( 9.93 KB )
- /www/wwwroot/xpshop/vendor/symfony/deprecation-contracts/function.php ( 1.02 KB )
- /www/wwwroot/xpshop/vendor/ezyang/htmlpurifier/library/HTMLPurifier.composer.php ( 0.10 KB )
- /www/wwwroot/xpshop/vendor/hyperf/engine/src/Functions.php ( 0.87 KB )
- /www/wwwroot/xpshop/vendor/ralouphie/getallheaders/src/getallheaders.php ( 1.65 KB )
- /www/wwwroot/xpshop/vendor/symfony/polyfill-php80/bootstrap.php ( 1.54 KB )
- /www/wwwroot/xpshop/vendor/symfony/translation/Resources/functions.php ( 0.57 KB )
- /www/wwwroot/xpshop/vendor/thinkcmf/cmf/src/common.php ( 105.49 KB )
- /www/wwwroot/xpshop/vendor/yansongda/supports/src/Functions.php ( 1.59 KB )
- /www/wwwroot/xpshop/vendor/guzzlehttp/guzzle/src/functions_include.php ( 0.16 KB )
- /www/wwwroot/xpshop/vendor/guzzlehttp/guzzle/src/functions.php ( 5.72 KB )
- /www/wwwroot/xpshop/vendor/topthink/think-queue/src/common.php ( 1.04 KB )
- /www/wwwroot/xpshop/vendor/yansongda/pay/src/Functions.php ( 11.15 KB )
- /www/wwwroot/xpshop/vendor/thinkcmf/cmf/think/App.php ( 18.43 KB )
- /www/wwwroot/xpshop/vendor/topthink/framework/src/think/Container.php ( 15.93 KB )
- /www/wwwroot/xpshop/vendor/psr/container/src/ContainerInterface.php ( 1.06 KB )
- /www/wwwroot/xpshop/vendor/thinkcmf/cmf-app/src/provider.php ( 0.25 KB )
- /www/wwwroot/xpshop/vendor/thinkcmf/cmf/think/Http.php ( 7.47 KB )
- /www/wwwroot/xpshop/vendor/topthink/think-helper/src/helper/Str.php ( 7.51 KB )
- /www/wwwroot/xpshop/vendor/topthink/framework/src/think/Env.php ( 4.87 KB )
- /www/wwwroot/xpshop/app/common.php ( 3.15 KB )
- /www/wwwroot/xpshop/vendor/topthink/framework/src/helper.php ( 19.12 KB )
- /www/wwwroot/xpshop/vendor/topthink/framework/src/think/Config.php ( 4.79 KB )
- /www/wwwroot/xpshop/vendor/thinkcmf/cmf/src/config/app.php ( 1.39 KB )
- /www/wwwroot/xpshop/vendor/topthink/framework/src/think/facade/Env.php ( 1.71 KB )
- /www/wwwroot/xpshop/vendor/thinkcmf/cmf/src/config/cache.php ( 0.83 KB )
- /www/wwwroot/xpshop/vendor/thinkcmf/cmf/src/config/console.php ( 1.14 KB )
- /www/wwwroot/xpshop/vendor/thinkcmf/cmf/src/config/log.php ( 1.41 KB )
- /www/wwwroot/xpshop/vendor/thinkcmf/cmf/src/config/route.php ( 1.59 KB )
- /www/wwwroot/xpshop/vendor/thinkcmf/cmf/src/config/template.php ( 0.65 KB )
- /www/wwwroot/xpshop/vendor/thinkcmf/cmf/src/config/view.php ( 1.09 KB )
- /www/wwwroot/xpshop/config/app.php ( 0.09 KB )
- /www/wwwroot/xpshop/config/queue.php ( 1.33 KB )
- /www/wwwroot/xpshop/data/config/config.php ( 0.09 KB )
- /www/wwwroot/xpshop/data/config/database.php ( 2.40 KB )
- /www/wwwroot/xpshop/data/config/lang.php ( 0.46 KB )
- /www/wwwroot/xpshop/vendor/thinkcmf/cmf-app/src/event.php ( 0.58 KB )
- /www/wwwroot/xpshop/vendor/topthink/framework/src/think/Event.php ( 7.23 KB )
- /www/wwwroot/xpshop/app/event.php ( 0.25 KB )
- /www/wwwroot/xpshop/vendor/topthink/framework/src/think/Lang.php ( 7.49 KB )
- /www/wwwroot/xpshop/vendor/thinkcmf/cmf/src/listener/InitHookListener.php ( 2.59 KB )
- /www/wwwroot/xpshop/vendor/topthink/framework/src/think/facade/Route.php ( 4.76 KB )
- /www/wwwroot/xpshop/vendor/thinkcmf/cmf/think/Route.php ( 24.37 KB )
- /www/wwwroot/xpshop/vendor/topthink/framework/src/think/route/RuleName.php ( 5.55 KB )
- /www/wwwroot/xpshop/vendor/topthink/framework/src/think/route/Domain.php ( 5.71 KB )
- /www/wwwroot/xpshop/vendor/topthink/framework/src/think/route/RuleGroup.php ( 13.91 KB )
- /www/wwwroot/xpshop/vendor/thinkcmf/cmf/think/route/Rule.php ( 24.55 KB )
- /www/wwwroot/xpshop/vendor/topthink/framework/src/think/route/RuleItem.php ( 9.50 KB )
- /www/wwwroot/xpshop/vendor/topthink/framework/src/think/facade/Cache.php ( 2.11 KB )
- /www/wwwroot/xpshop/vendor/topthink/framework/src/think/Cache.php ( 5.11 KB )
- /www/wwwroot/xpshop/vendor/topthink/framework/src/think/Manager.php ( 4.09 KB )
- /www/wwwroot/xpshop/vendor/psr/simple-cache/src/CacheInterface.php ( 4.82 KB )
- /www/wwwroot/xpshop/vendor/topthink/think-helper/src/helper/Arr.php ( 16.72 KB )
- /www/wwwroot/xpshop/vendor/topthink/framework/src/think/cache/driver/File.php ( 7.89 KB )
- /www/wwwroot/xpshop/vendor/topthink/framework/src/think/cache/Driver.php ( 8.52 KB )
- /www/wwwroot/xpshop/vendor/topthink/framework/src/think/contract/CacheHandlerInterface.php ( 2.06 KB )
- /www/wwwroot/xpshop/vendor/topthink/framework/src/think/facade/Event.php ( 1.83 KB )
- /www/wwwroot/xpshop/app/listener/InitHookListener.php ( 0.82 KB )
- /www/wwwroot/xpshop/app/portal/route.php ( 7.83 KB )
- /www/wwwroot/xpshop/vendor/topthink/framework/src/think/Request.php ( 56.59 KB )
- /www/wwwroot/xpshop/vendor/topthink/think-orm/src/facade/Db.php ( 0.96 KB )
- /www/wwwroot/xpshop/vendor/topthink/framework/src/think/Db.php ( 2.99 KB )
- /www/wwwroot/xpshop/vendor/topthink/think-orm/src/DbManager.php ( 8.72 KB )
- /www/wwwroot/xpshop/vendor/topthink/framework/src/think/Log.php ( 6.51 KB )
- /www/wwwroot/xpshop/vendor/psr/log/src/LoggerTrait.php ( 2.79 KB )
- /www/wwwroot/xpshop/vendor/psr/log/src/LoggerInterface.php ( 2.80 KB )
- /www/wwwroot/xpshop/vendor/topthink/think-orm/src/db/connector/Mysql.php ( 4.50 KB )
- /www/wwwroot/xpshop/vendor/topthink/think-orm/src/db/PDOConnection.php ( 53.54 KB )
- /www/wwwroot/xpshop/vendor/topthink/think-orm/src/db/Connection.php ( 9.19 KB )
- /www/wwwroot/xpshop/vendor/topthink/think-orm/src/db/ConnectionInterface.php ( 5.08 KB )
- /www/wwwroot/xpshop/vendor/topthink/think-orm/src/db/builder/Mysql.php ( 17.07 KB )
- /www/wwwroot/xpshop/vendor/topthink/think-orm/src/db/Builder.php ( 23.03 KB )
- /www/wwwroot/xpshop/vendor/topthink/think-orm/src/db/BaseBuilder.php ( 28.23 KB )
- /www/wwwroot/xpshop/vendor/topthink/think-orm/src/db/Query.php ( 14.82 KB )
- /www/wwwroot/xpshop/vendor/topthink/think-orm/src/db/BaseQuery.php ( 42.79 KB )
- /www/wwwroot/xpshop/vendor/topthink/think-orm/src/db/concern/TimeFieldQuery.php ( 7.65 KB )
- /www/wwwroot/xpshop/vendor/topthink/think-orm/src/db/concern/AggregateQuery.php ( 3.39 KB )
- /www/wwwroot/xpshop/vendor/topthink/think-orm/src/db/concern/ModelRelationQuery.php ( 19.62 KB )
- /www/wwwroot/xpshop/vendor/topthink/think-orm/src/db/concern/ParamsBind.php ( 3.80 KB )
- /www/wwwroot/xpshop/vendor/topthink/think-orm/src/db/concern/ResultOperation.php ( 6.90 KB )
- /www/wwwroot/xpshop/vendor/topthink/think-orm/src/db/concern/Transaction.php ( 2.90 KB )
- /www/wwwroot/xpshop/vendor/topthink/think-orm/src/db/concern/WhereQuery.php ( 18.40 KB )
- /www/wwwroot/xpshop/vendor/topthink/think-orm/src/db/concern/JoinAndViewQuery.php ( 7.23 KB )
- /www/wwwroot/xpshop/vendor/topthink/think-orm/src/db/concern/TableFieldInfo.php ( 2.56 KB )
- /www/wwwroot/xpshop/vendor/topthink/framework/src/think/log/driver/File.php ( 6.38 KB )
- /www/wwwroot/xpshop/vendor/topthink/framework/src/think/contract/LogHandlerInterface.php ( 0.89 KB )
- /www/wwwroot/xpshop/vendor/topthink/framework/src/think/log/Channel.php ( 4.04 KB )
- /www/wwwroot/xpshop/vendor/topthink/framework/src/think/event/LogRecord.php ( 0.89 KB )
- /www/wwwroot/xpshop/vendor/topthink/framework/src/think/initializer/Error.php ( 3.38 KB )
- /www/wwwroot/xpshop/vendor/topthink/framework/src/think/initializer/RegisterService.php ( 1.37 KB )
- /www/wwwroot/xpshop/vendor/services.php ( 0.25 KB )
- /www/wwwroot/xpshop/vendor/topthink/framework/src/think/service/PaginatorService.php ( 1.57 KB )
- /www/wwwroot/xpshop/vendor/topthink/framework/src/think/Service.php ( 1.70 KB )
- /www/wwwroot/xpshop/vendor/topthink/framework/src/think/service/ValidateService.php ( 1.02 KB )
- /www/wwwroot/xpshop/vendor/topthink/framework/src/think/service/ModelService.php ( 1.80 KB )
- /www/wwwroot/xpshop/vendor/thinkcmf/cmf-appstore/src/AppStoreService.php ( 1.12 KB )
- /www/wwwroot/xpshop/vendor/topthink/think-queue/src/queue/Service.php ( 1.29 KB )
- /www/wwwroot/xpshop/vendor/topthink/think-trace/src/Service.php ( 0.79 KB )
- /www/wwwroot/xpshop/vendor/topthink/framework/src/think/Middleware.php ( 6.89 KB )
- /www/wwwroot/xpshop/vendor/xia/migration/src/Service.php ( 2.02 KB )
- /www/wwwroot/xpshop/vendor/topthink/framework/src/think/initializer/BootService.php ( 0.79 KB )
- /www/wwwroot/xpshop/vendor/topthink/think-orm/src/Paginator.php ( 12.21 KB )
- /www/wwwroot/xpshop/vendor/topthink/framework/src/think/Validate.php ( 48.38 KB )
- /www/wwwroot/xpshop/vendor/topthink/think-orm/src/Model.php ( 27.82 KB )
- /www/wwwroot/xpshop/vendor/topthink/think-orm/src/model/concern/Attribute.php ( 19.62 KB )
- /www/wwwroot/xpshop/vendor/topthink/think-orm/src/model/concern/RelationShip.php ( 27.32 KB )
- /www/wwwroot/xpshop/vendor/topthink/think-orm/src/model/concern/ModelEvent.php ( 2.33 KB )
- /www/wwwroot/xpshop/vendor/topthink/think-orm/src/model/concern/TimeStamp.php ( 5.92 KB )
- /www/wwwroot/xpshop/vendor/topthink/think-orm/src/model/concern/AutoWriteId.php ( 1.50 KB )
- /www/wwwroot/xpshop/vendor/topthink/think-orm/src/model/concern/Conversion.php ( 11.25 KB )
- /www/wwwroot/xpshop/vendor/topthink/think-helper/src/contract/Arrayable.php ( 0.10 KB )
- /www/wwwroot/xpshop/vendor/topthink/think-helper/src/contract/Jsonable.php ( 0.14 KB )
- /www/wwwroot/xpshop/vendor/thinkcmf/cmf/think/Console.php ( 23.46 KB )
- /www/wwwroot/xpshop/vendor/thinkcmf/cmf-app/src/middleware.php ( 0.26 KB )
- /www/wwwroot/xpshop/vendor/topthink/framework/src/think/Pipeline.php ( 2.71 KB )
- /www/wwwroot/xpshop/vendor/topthink/think-trace/src/TraceDebug.php ( 3.05 KB )
- /www/wwwroot/xpshop/vendor/thinkcmf/cmf/src/middleware/LangDetect.php ( 5.94 KB )
- /www/wwwroot/xpshop/vendor/topthink/framework/src/think/Cookie.php ( 6.19 KB )
- /www/wwwroot/xpshop/vendor/topthink/framework/src/think/middleware/SessionInit.php ( 2.01 KB )
- /www/wwwroot/xpshop/vendor/topthink/framework/src/think/Session.php ( 1.86 KB )
- /www/wwwroot/xpshop/vendor/topthink/framework/src/think/session/driver/File.php ( 6.52 KB )
- /www/wwwroot/xpshop/vendor/topthink/framework/src/think/contract/SessionHandlerInterface.php ( 0.89 KB )
- /www/wwwroot/xpshop/vendor/topthink/framework/src/think/session/Store.php ( 7.37 KB )
- /www/wwwroot/xpshop/data/route/route.php ( 10.75 KB )
- /www/wwwroot/xpshop/vendor/thinkcmf/cmf/think/route/dispatch/Controller.php ( 7.73 KB )
- /www/wwwroot/xpshop/vendor/topthink/framework/src/think/route/Dispatch.php ( 6.29 KB )
- /www/wwwroot/xpshop/vendor/thinkcmf/cmf/src/listener/ModuleInitListener.php ( 2.20 KB )
- /www/wwwroot/xpshop/vendor/topthink/think-helper/src/Collection.php ( 17.14 KB )
- /www/wwwroot/xpshop/app/portal/controller/BlogController.php ( 5.17 KB )
- /www/wwwroot/xpshop/vendor/thinkcmf/cmf/src/controller/HomeBaseController.php ( 13.79 KB )
- /www/wwwroot/xpshop/vendor/thinkcmf/cmf/src/controller/BaseController.php ( 10.69 KB )
- /www/wwwroot/xpshop/vendor/thinkcmf/cmf/think/View.php ( 5.21 KB )
- /www/wwwroot/xpshop/vendor/topthink/framework/src/think/facade/Config.php ( 1.41 KB )
- /www/wwwroot/xpshop/vendor/topthink/framework/src/think/facade/Cookie.php ( 1.52 KB )
- /www/wwwroot/xpshop/vendor/thinkcmf/cmf/think/view/driver/Think.php ( 8.67 KB )
- /www/wwwroot/xpshop/vendor/thinkcmf/cmf/think/Template.php ( 55.14 KB )
- /www/wwwroot/xpshop/vendor/thinkcmf/cmf/think/template/driver/File.php ( 2.42 KB )
- /www/wwwroot/xpshop/vendor/thinkcmf/cmf-app/src/admin/model/LinkModel.php ( 0.92 KB )
- /www/wwwroot/xpshop/vendor/topthink/think-orm/src/model/Collection.php ( 6.93 KB )
- /www/wwwroot/xpshop/api/portal/model/SocialModel.php ( 2.51 KB )
- /www/wwwroot/xpshop/vendor/thinkcmf/cmf/src/listener/HomeLangListener.php ( 3.40 KB )
- /www/wwwroot/xpshop/vendor/topthink/framework/src/think/facade/Session.php ( 1.84 KB )
- /www/wwwroot/xpshop/app/listener/HomeInitListener.php ( 3.09 KB )
- /www/wwwroot/xpshop/api/portal/model/NewsModel.php ( 1.73 KB )
- /www/wwwroot/xpshop/vendor/thinkcmf/cmf/src/lib/Storage.php ( 4.40 KB )
- /www/wwwroot/xpshop/vendor/thinkcmf/cmf/src/lib/storage/Local.php ( 2.97 KB )
- /www/wwwroot/xpshop/api/portal/model/PortalPostModel.php ( 26.71 KB )
- /www/wwwroot/xpshop/vendor/topthink/think-orm/src/db/Raw.php ( 1.28 KB )
- /www/wwwroot/xpshop/vendor/thinkcmf/cmf-app/src/admin/model/ThemeModel.php ( 12.56 KB )
- /www/wwwroot/xpshop/vendor/thinkcmf/cmf-app/src/admin/model/ThemeFileModel.php ( 1.96 KB )
- /www/wwwroot/xpshop/data/runtime/temp/english_6df7f0f34cddea77df5aa1fa9591dd7b.php ( 62.29 KB )
- /www/wwwroot/xpshop/vendor/thinkcmf/cmf-app/src/admin/model/NavMenuModel.php ( 9.60 KB )
- /www/wwwroot/xpshop/vendor/thinkcmf/cmf-extend/src/tree/Tree.php ( 10.30 KB )
- /www/wwwroot/xpshop/vendor/thinkcmf/cmf-app/src/admin/model/RouteModel.php ( 8.92 KB )
- /www/wwwroot/xpshop/app/portal/url.php ( 1.60 KB )
- /www/wwwroot/xpshop/vendor/thinkcmf/cmf-app/src/user/url.php ( 1.01 KB )
- /www/wwwroot/xpshop/vendor/thinkcmf/cmf/think/route/Url.php ( 17.14 KB )
- /www/wwwroot/xpshop/vendor/topthink/framework/src/think/Response.php ( 9.05 KB )
- /www/wwwroot/xpshop/vendor/topthink/framework/src/think/response/Html.php ( 1.01 KB )
- /www/wwwroot/xpshop/vendor/topthink/think-trace/src/Html.php ( 4.49 KB )
- CONNECT:[ UseTime:0.000298s ] mysql:host=127.0.0.1;port=3306;dbname=xpshop;charset=utf8mb4
- SHOW FULL COLUMNS FROM `cmf_news` [ RunTime:0.001007s ]
- SELECT * FROM `cmf_news` WHERE `news_status` = 1 AND `slug` = 'overcoming-network-bottlenecks-enterprise-configuration-manual-for-inspecting-memory-leak-trends-using-built-in-performance-monitors' LIMIT 1 [ RunTime:0.003336s ]
- SHOW FULL COLUMNS FROM `cmf_link` [ RunTime:0.000947s ]
- SELECT * FROM `cmf_link` WHERE `status` = 1 [ RunTime:0.000228s ]
- SHOW FULL COLUMNS FROM `cmf_social` [ RunTime:0.000855s ]
- SELECT * FROM `cmf_social` WHERE `status` = 1 [ RunTime:0.000230s ]
- SHOW FULL COLUMNS FROM `cmf_portal_category` [ RunTime:0.000897s ]
- SELECT * FROM `cmf_portal_category` WHERE `module_id` = 2 ORDER BY `list_order` ASC [ RunTime:0.000395s ]
- SHOW FULL COLUMNS FROM `cmf_countries` [ RunTime:0.000741s ]
- SELECT * FROM `cmf_countries` [ RunTime:0.000247s ]
- SELECT * FROM `cmf_news` WHERE `slug` = 'overcoming-network-bottlenecks-enterprise-configuration-manual-for-inspecting-memory-leak-trends-using-built-in-performance-monitors' LIMIT 1 [ RunTime:0.003030s ]
- SHOW FULL COLUMNS FROM `cmf_option` [ RunTime:0.000796s ]
- SELECT `option_value` FROM `cmf_option` WHERE `option_name` = 'storage' LIMIT 1 [ RunTime:0.000164s ]
- SELECT * FROM `cmf_news` WHERE `news_status` = 1 ORDER BY `create_time` DESC LIMIT 3 [ RunTime:0.003205s ]
- SHOW FULL COLUMNS FROM `cmf_portal_post` [ RunTime:0.001195s ]
- SELECT * FROM `cmf_portal_post` WHERE 0 = 1 AND `post_type` = 1 [ RunTime:0.000217s ]
- SHOW FULL COLUMNS FROM `cmf_news_comment` [ RunTime:0.000749s ]
- SELECT * FROM `cmf_news_comment` WHERE `news_id` = 1148 AND `status` = 1 ORDER BY `create_time` ASC [ RunTime:0.000204s ]
- SELECT * FROM `cmf_news` ORDER BY RAND() LIMIT 5 [ RunTime:0.006511s ]
- SELECT * FROM `cmf_news` ORDER BY RAND() LIMIT 5 [ RunTime:0.005804s ]
- SELECT * FROM `cmf_news` ORDER BY RAND() LIMIT 5 [ RunTime:0.005206s ]
- SELECT * FROM `cmf_news` ORDER BY `create_time` DESC LIMIT 5 [ RunTime:0.003161s ]
- SHOW FULL COLUMNS FROM `cmf_theme_file` [ RunTime:0.000898s ]
- SELECT * FROM `cmf_theme_file` WHERE `theme` = 'default' AND `file` = 'portal/404' LIMIT 1 [ RunTime:0.000252s ]
- UPDATE `cmf_theme_file` SET `theme` = 'default' , `action` = 'portal/Index/Notfound' , `file` = 'portal/404' , `name` = '首页' , `more` = '{\"widgets_blocks\":{\"top\":{\"title\":\"\\u9876\\u90e8\",\"widgets\":{\"top_nav_202206300003\":{\"title\":\"\\u9876\\u90e8\\u5bfc\\u822a\",\"name\":\"nav\",\"display\":\"1\",\"public_widget_id\":\"top_nav\",\"version\":\"1.0.0\",\"action\":\"\",\"vars\":{\"company_name\":\"ThinkCMF\",\"nav_id\":\"\"}}}},\"body\":{\"title\":\"\\u4e3b\\u4f53\",\"widgets\":{\"home_slider_202206300003\":{\"title\":\"\\u9996\\u9875\\u5e7b\\u706f\\u7247\",\"name\":\"slider\",\"display\":\"1\",\"version\":\"1.0.0\",\"action\":\"\",\"vars\":{\"slide_id\":\"\",\"fullscreen\":1}},\"home_features_202206300003\":{\"title\":\"\\u4ea7\\u54c1\\u7279\\u6027\",\"name\":\"features\",\"display\":\"1\",\"version\":\"1.0.0\",\"action\":\"\",\"vars\":{\"sub_title\":\"Quickly understand the ThinkCMF\",\"features\":[{\"title\":\"MVC\\u5206\\u5c42\\u6a21\\u5f0f\",\"icon\":\"bars\",\"content\":\"\\u4f7f\\u7528MVC\\u5e94\\u7528\\u7a0b\\u5e8f\\u88ab\\u5206\\u6210\\u4e09\\u4e2a\\u6838\\u5fc3\\u90e8\\u4ef6\\uff1a\\u6a21\\u578b\\uff08M\\uff09\\u3001\\u89c6\\u56fe\\uff08V\\uff09\\u3001\\u63a7\\u5236\\u5668\\uff08C\\uff09\\uff0c\\u4ed6\\u4e0d\\u662f\\u4e00\\u4e2a\\u65b0\\u7684\\u6982\\u5ff5\\uff0c\\u53ea\\u662fThinkCMF\\u5c06\\u5176\\u53d1\\u6325\\u5230\\u4e86\\u6781\\u81f4\\u3002\"},{\"title\":\"\\u7528\\u6237\\u7ba1\\u7406\",\"icon\":\"group\",\"content\":\"ThinkCMF\\u5185\\u7f6e\\u4e86\\u7075\\u6d3b\\u7684\\u7528\\u6237\\u7ba1\\u7406\\u65b9\\u5f0f\\uff0c\\u5e76\\u53ef\\u76f4\\u63a5\\u4e0e\\u7b2c\\u4e09\\u65b9\\u7ad9\\u70b9\\u8fdb\\u884c\\u4e92\\u8054\\u4e92\\u901a\\uff0c\\u5982\\u679c\\u4f60\\u613f\\u610f\\u751a\\u81f3\\u53ef\\u4ee5\\u5bf9\\u5355\\u4e2a\\u7528\\u6237\\u6216\\u7fa4\\u4f53\\u7528\\u6237\\u7684\\u884c\\u4e3a\\u8fdb\\u884c\\u8bb0\\u5f55\\u53ca\\u5206\\u4eab\\uff0c\\u4e3a\\u60a8\\u7684\\u8fd0\\u8425\\u51b3\\u7b56\\u63d0\\u4f9b\\u6709\\u6548\\u53c2\\u8003\\u6570\\u636e\\u3002\"},{\"title\":\"\\u4e91\\u7aef\\u90e8\\u7f72\",\"icon\":\"cloud\",\"content\":\"\\u901a\\u8fc7\\u9a71\\u52a8\\u7684\\u65b9\\u5f0f\\u53ef\\u4ee5\\u8f7b\\u677e\\u652f\\u6301\\u4e91\\u5e73\\u53f0\\u7684\\u90e8\\u7f72\\uff0c\\u8ba9\\u4f60\\u7684\\u7f51\\u7ad9\\u65e0\\u7f1d\\u8fc1\\u79fb\\uff0c\\u5185\\u7f6e\\u5df2\\u7ecf\\u652f\\u6301SAE\\u3001BAE\\uff0c\\u6b63\\u5f0f\\u7248\\u5c06\\u5bf9\\u4e91\\u7aef\\u90e8\\u7f72\\u8fdb\\u884c\\u8fdb\\u4e00\\u6b65\\u4f18\\u5316\\u3002\"},{\"title\":\"\\u5b89\\u5168\\u7b56\\u7565\",\"icon\":\"heart\",\"content\":\"\\u63d0\\u4f9b\\u7684\\u7a33\\u5065\\u7684\\u5b89\\u5168\\u7b56\\u7565\\uff0c\\u5305\\u62ec\\u5907\\u4efd\\u6062\\u590d\\uff0c\\u5bb9\\u9519\\uff0c\\u9632\\u6cbb\\u6076\\u610f\\u653b\\u51fb\\u767b\\u9646\\uff0c\\u7f51\\u9875\\u9632\\u7be1\\u6539\\u7b49\\u591a\\u9879\\u5b89\\u5168\\u7ba1\\u7406\\u529f\\u80fd\\uff0c\\u4fdd\\u8bc1\\u7cfb\\u7edf\\u5b89\\u5168\\uff0c\\u53ef\\u9760\\uff0c\\u7a33\\u5b9a\\u7684\\u8fd0\\u884c\\u3002\"},{\"title\":\"\\u5e94\\u7528\\u6a21\\u5757\\u5316\",\"icon\":\"cubes\",\"content\":\"\\u63d0\\u51fa\\u5168\\u65b0\\u7684\\u5e94\\u7528\\u6a21\\u5f0f\\u8fdb\\u884c\\u6269\\u5c55\\uff0c\\u4e0d\\u7ba1\\u662f\\u4f60\\u5f00\\u53d1\\u4e00\\u4e2a\\u5c0f\\u529f\\u80fd\\u8fd8\\u662f\\u4e00\\u4e2a\\u5168\\u65b0\\u7684\\u7ad9\\u70b9\\uff0c\\u5728ThinkCMF\\u4e2d\\u4f60\\u53ea\\u662f\\u589e\\u52a0\\u4e86\\u4e00\\u4e2aAPP\\uff0c\\u6bcf\\u4e2a\\u72ec\\u7acb\\u8fd0\\u884c\\u4e92\\u4e0d\\u5f71\\u54cd\\uff0c\\u4fbf\\u4e8e\\u7075\\u6d3b\\u6269\\u5c55\\u548c\\u4e8c\\u6b21\\u5f00\\u53d1\\u3002\"},{\"title\":\"\\u514d\\u8d39\\u5f00\\u6e90\",\"icon\":\"certificate\",\"content\":\"\\u4ee3\\u7801\\u9075\\u5faaApache2\\u5f00\\u6e90\\u534f\\u8bae\\uff0c\\u514d\\u8d39\\u4f7f\\u7528\\uff0c\\u5bf9\\u5546\\u4e1a\\u7528\\u6237\\u4e5f\\u65e0\\u4efb\\u4f55\\u9650\\u5236\\u3002\"}]}},\"home_last_news_202206300003\":{\"title\":\"\\u6700\\u65b0\\u8d44\\u8baf\",\"name\":\"last_news\",\"display\":\"1\",\"version\":\"1.0.0\",\"action\":\"\",\"vars\":{\"last_news_category_id\":\"\"}},\"home_last_news_202206300004\":{\"title\":\"\\u6700\\u65b0\\u8d44\\u8baf\",\"name\":\"last_news\",\"display\":\"1\",\"version\":\"1.0.0\",\"action\":\"\",\"vars\":{\"last_news_category_id\":\"\"}}}},\"footer\":{\"title\":\"\\u5e95\\u90e8\",\"widgets\":{\"home_footer_202206300003\":{\"title\":\"\\u5e95\\u90e8\",\"name\":\"footer\",\"display\":\"1\",\"public_widget_id\":\"footer\",\"version\":\"1.0.0\",\"action\":\"\",\"vars\":{\"company_name\":\"ThinkCMF\",\"nav_id\":\"2\"}}}}}}' , `config_more` = '{\"widgets_blocks\":{\"top\":{\"title\":\"\\u9876\\u90e8\",\"widgets\":{\"top_nav_202206300003\":{\"title\":\"\\u9876\\u90e8\\u5bfc\\u822a\",\"name\":\"nav\",\"display\":\"1\",\"public_widget_id\":\"top_nav\"}}},\"body\":{\"title\":\"\\u4e3b\\u4f53\",\"widgets\":{\"home_slider_202206300003\":{\"title\":\"\\u9996\\u9875\\u5e7b\\u706f\\u7247\",\"name\":\"slider\",\"display\":\"1\"},\"home_features_202206300003\":{\"title\":\"\\u4ea7\\u54c1\\u7279\\u6027\",\"name\":\"features\",\"display\":\"1\"},\"home_last_news_202206300003\":{\"title\":\"\\u6700\\u65b0\\u8d44\\u8baf\",\"name\":\"last_news\",\"display\":\"1\"},\"home_last_news_202206300004\":{\"title\":\"\\u6700\\u65b0\\u8d44\\u8baf\",\"name\":\"last_news\",\"display\":\"1\"}}},\"footer\":{\"title\":\"\\u5e95\\u90e8\",\"widgets\":{\"home_footer_202206300003\":{\"title\":\"\\u5e95\\u90e8\",\"name\":\"footer\",\"display\":\"1\",\"public_widget_id\":\"footer\"}}}}}' , `description` = '首页模板文件' , `is_public` = 0 , `list_order` = '5' WHERE `theme` = 'default' AND `file` = 'portal/404' [ RunTime:0.008241s ]
- SELECT * FROM `cmf_theme_file` WHERE `theme` = 'default' AND `file` = 'portal/about' LIMIT 1 [ RunTime:0.000227s ]
- UPDATE `cmf_theme_file` SET `theme` = 'default' , `action` = 'portal/Index/index' , `file` = 'portal/about' , `name` = '首页' , `more` = '{\"widgets_blocks\":{\"top\":{\"title\":\"\\u9876\\u90e8\",\"widgets\":{\"top_nav_202206300003\":{\"title\":\"\\u9876\\u90e8\\u5bfc\\u822a\",\"name\":\"nav\",\"display\":\"1\",\"public_widget_id\":\"top_nav\",\"version\":\"1.0.0\",\"action\":\"\",\"vars\":{\"company_name\":\"ThinkCMF\",\"nav_id\":\"\"}}}},\"body\":{\"title\":\"\\u4e3b\\u4f53\",\"widgets\":{\"home_slider_202206300003\":{\"title\":\"home\",\"name\":\"slider\",\"display\":\"1\",\"vars\":{\"slide_id\":\"23\",\"fullscreen\":1}},\"home_features_202206300003\":{\"title\":\"\\u4ea7\\u54c1\\u7279\\u6027\",\"name\":\"features\",\"display\":\"1\",\"version\":\"1.0.0\",\"action\":\"\",\"vars\":{\"sub_title\":\"Quickly understand the ThinkCMF\",\"features\":[{\"title\":\"MVC\\u5206\\u5c42\\u6a21\\u5f0f\",\"icon\":\"bars\",\"content\":\"\\u4f7f\\u7528MVC\\u5e94\\u7528\\u7a0b\\u5e8f\\u88ab\\u5206\\u6210\\u4e09\\u4e2a\\u6838\\u5fc3\\u90e8\\u4ef6\\uff1a\\u6a21\\u578b\\uff08M\\uff09\\u3001\\u89c6\\u56fe\\uff08V\\uff09\\u3001\\u63a7\\u5236\\u5668\\uff08C\\uff09\\uff0c\\u4ed6\\u4e0d\\u662f\\u4e00\\u4e2a\\u65b0\\u7684\\u6982\\u5ff5\\uff0c\\u53ea\\u662fThinkCMF\\u5c06\\u5176\\u53d1\\u6325\\u5230\\u4e86\\u6781\\u81f4\\u3002\"},{\"title\":\"\\u7528\\u6237\\u7ba1\\u7406\",\"icon\":\"group\",\"content\":\"ThinkCMF\\u5185\\u7f6e\\u4e86\\u7075\\u6d3b\\u7684\\u7528\\u6237\\u7ba1\\u7406\\u65b9\\u5f0f\\uff0c\\u5e76\\u53ef\\u76f4\\u63a5\\u4e0e\\u7b2c\\u4e09\\u65b9\\u7ad9\\u70b9\\u8fdb\\u884c\\u4e92\\u8054\\u4e92\\u901a\\uff0c\\u5982\\u679c\\u4f60\\u613f\\u610f\\u751a\\u81f3\\u53ef\\u4ee5\\u5bf9\\u5355\\u4e2a\\u7528\\u6237\\u6216\\u7fa4\\u4f53\\u7528\\u6237\\u7684\\u884c\\u4e3a\\u8fdb\\u884c\\u8bb0\\u5f55\\u53ca\\u5206\\u4eab\\uff0c\\u4e3a\\u60a8\\u7684\\u8fd0\\u8425\\u51b3\\u7b56\\u63d0\\u4f9b\\u6709\\u6548\\u53c2\\u8003\\u6570\\u636e\\u3002\"},{\"title\":\"\\u4e91\\u7aef\\u90e8\\u7f72\",\"icon\":\"cloud\",\"content\":\"\\u901a\\u8fc7\\u9a71\\u52a8\\u7684\\u65b9\\u5f0f\\u53ef\\u4ee5\\u8f7b\\u677e\\u652f\\u6301\\u4e91\\u5e73\\u53f0\\u7684\\u90e8\\u7f72\\uff0c\\u8ba9\\u4f60\\u7684\\u7f51\\u7ad9\\u65e0\\u7f1d\\u8fc1\\u79fb\\uff0c\\u5185\\u7f6e\\u5df2\\u7ecf\\u652f\\u6301SAE\\u3001BAE\\uff0c\\u6b63\\u5f0f\\u7248\\u5c06\\u5bf9\\u4e91\\u7aef\\u90e8\\u7f72\\u8fdb\\u884c\\u8fdb\\u4e00\\u6b65\\u4f18\\u5316\\u3002\"},{\"title\":\"\\u5b89\\u5168\\u7b56\\u7565\",\"icon\":\"heart\",\"content\":\"\\u63d0\\u4f9b\\u7684\\u7a33\\u5065\\u7684\\u5b89\\u5168\\u7b56\\u7565\\uff0c\\u5305\\u62ec\\u5907\\u4efd\\u6062\\u590d\\uff0c\\u5bb9\\u9519\\uff0c\\u9632\\u6cbb\\u6076\\u610f\\u653b\\u51fb\\u767b\\u9646\\uff0c\\u7f51\\u9875\\u9632\\u7be1\\u6539\\u7b49\\u591a\\u9879\\u5b89\\u5168\\u7ba1\\u7406\\u529f\\u80fd\\uff0c\\u4fdd\\u8bc1\\u7cfb\\u7edf\\u5b89\\u5168\\uff0c\\u53ef\\u9760\\uff0c\\u7a33\\u5b9a\\u7684\\u8fd0\\u884c\\u3002\"},{\"title\":\"\\u5e94\\u7528\\u6a21\\u5757\\u5316\",\"icon\":\"cubes\",\"content\":\"\\u63d0\\u51fa\\u5168\\u65b0\\u7684\\u5e94\\u7528\\u6a21\\u5f0f\\u8fdb\\u884c\\u6269\\u5c55\\uff0c\\u4e0d\\u7ba1\\u662f\\u4f60\\u5f00\\u53d1\\u4e00\\u4e2a\\u5c0f\\u529f\\u80fd\\u8fd8\\u662f\\u4e00\\u4e2a\\u5168\\u65b0\\u7684\\u7ad9\\u70b9\\uff0c\\u5728ThinkCMF\\u4e2d\\u4f60\\u53ea\\u662f\\u589e\\u52a0\\u4e86\\u4e00\\u4e2aAPP\\uff0c\\u6bcf\\u4e2a\\u72ec\\u7acb\\u8fd0\\u884c\\u4e92\\u4e0d\\u5f71\\u54cd\\uff0c\\u4fbf\\u4e8e\\u7075\\u6d3b\\u6269\\u5c55\\u548c\\u4e8c\\u6b21\\u5f00\\u53d1\\u3002\"},{\"title\":\"\\u514d\\u8d39\\u5f00\\u6e90\",\"icon\":\"certificate\",\"content\":\"\\u4ee3\\u7801\\u9075\\u5faaApache2\\u5f00\\u6e90\\u534f\\u8bae\\uff0c\\u514d\\u8d39\\u4f7f\\u7528\\uff0c\\u5bf9\\u5546\\u4e1a\\u7528\\u6237\\u4e5f\\u65e0\\u4efb\\u4f55\\u9650\\u5236\\u3002\"}]}},\"home_last_news_202206300003\":{\"title\":\"\\u6700\\u65b0\\u8d44\\u8baf\",\"name\":\"last_news\",\"display\":\"1\",\"version\":\"1.0.0\",\"action\":\"\",\"vars\":{\"last_news_category_id\":\"\"}},\"home_last_news_202206300004\":{\"title\":\"\\u6700\\u65b0\\u8d44\\u8baf\",\"name\":\"last_news\",\"display\":\"1\",\"version\":\"1.0.0\",\"action\":\"\",\"vars\":{\"last_news_category_id\":\"\"}}}},\"footer\":{\"title\":\"\\u5e95\\u90e8\",\"widgets\":{\"home_footer_202206300003\":{\"title\":\"\\u5e95\\u90e8\",\"name\":\"footer\",\"display\":\"1\",\"public_widget_id\":\"footer\",\"version\":\"1.0.0\",\"action\":\"\",\"vars\":[]}}}}}' , `config_more` = '{\"widgets_blocks\":{\"top\":{\"title\":\"\\u9876\\u90e8\",\"widgets\":{\"top_nav_202206300003\":{\"title\":\"\\u9876\\u90e8\\u5bfc\\u822a\",\"name\":\"nav\",\"display\":\"1\",\"public_widget_id\":\"top_nav\"}}},\"body\":{\"title\":\"\\u4e3b\\u4f53\",\"widgets\":{\"home_slider_202206300003\":{\"title\":\"\\u9996\\u9875\\u5e7b\\u706f\\u7247\",\"name\":\"slider\",\"display\":\"1\"},\"home_features_202206300003\":{\"title\":\"\\u4ea7\\u54c1\\u7279\\u6027\",\"name\":\"features\",\"display\":\"1\"},\"home_last_news_202206300003\":{\"title\":\"\\u6700\\u65b0\\u8d44\\u8baf\",\"name\":\"last_news\",\"display\":\"1\"},\"home_last_news_202206300004\":{\"title\":\"\\u6700\\u65b0\\u8d44\\u8baf\",\"name\":\"last_news\",\"display\":\"1\"}}},\"footer\":{\"title\":\"\\u5e95\\u90e8\",\"widgets\":{\"home_footer_202206300003\":{\"title\":\"\\u5e95\\u90e8\",\"name\":\"footer\",\"display\":\"1\",\"public_widget_id\":\"footer\"}}}}}' , `description` = '首页模板文件' , `is_public` = 0 , `list_order` = '5' WHERE `theme` = 'default' AND `file` = 'portal/about' [ RunTime:0.007746s ]
- SELECT * FROM `cmf_theme_file` WHERE `theme` = 'default' AND `file` = 'portal/article' LIMIT 1 [ RunTime:0.000197s ]
- UPDATE `cmf_theme_file` SET `theme` = 'default' , `action` = 'portal/Article/index' , `file` = 'portal/article' , `name` = '文章页' , `more` = '{\"widgets_blocks\":{\"top\":{\"title\":\"\\u9876\\u90e8\",\"widgets\":{\"top_nav_202206300003\":{\"title\":\"\\u9876\\u90e8\\u5bfc\\u822a\",\"name\":\"nav\",\"display\":\"1\",\"public_widget_id\":\"top_nav\",\"version\":\"1.0.0\",\"action\":\"\",\"vars\":{\"company_name\":\"ThinkCMF\",\"nav_id\":\"\"}}}},\"body_left\":{\"title\":\"\\u4e3b\\u4f53\\u5de6\",\"widgets\":{\"article_202206300003\":{\"title\":\"\\u6587\\u7ae0\\u5185\\u5bb9\",\"name\":\"article\",\"display\":\"1\",\"version\":\"1.0.0\",\"action\":\"portal\\/Article\\/index\",\"vars\":[]},\"article_last_news_202206300003\":{\"title\":\"\\u6700\\u65b0\\u8d44\\u8baf\",\"name\":\"last_news\",\"display\":\"1\",\"version\":\"1.0.0\",\"action\":\"\",\"vars\":{\"last_news_category_id\":\"\"}}}},\"body_right\":{\"title\":\"\\u4e3b\\u4f53\\u53f3\",\"widgets\":{\"article_side_hot_articles_202206300004\":{\"title\":\"\\u70ed\\u95e8\\u6587\\u7ae0\",\"name\":\"side_hot_articles\",\"display\":\"1\",\"version\":\"1.0.0\",\"action\":\"\",\"vars\":{\"hottest_articles_category_id\":\"\"}},\"article_side_last_articles_202206300004\":{\"title\":\"\\u6700\\u65b0\\u6587\\u7ae0\",\"name\":\"side_last_articles\",\"display\":\"1\",\"version\":\"1.0.0\",\"action\":\"\",\"vars\":{\"last_articles_category_id\":\"\"}}}},\"footer\":{\"title\":\"\\u5e95\\u90e8\",\"widgets\":{\"footer_202206300003\":{\"title\":\"\\u5e95\\u90e8\",\"name\":\"footer\",\"display\":\"1\",\"public_widget_id\":\"footer\",\"version\":\"1.0.0\",\"action\":\"\",\"vars\":[]}}}}}' , `config_more` = '{\"widgets_blocks\":{\"top\":{\"title\":\"\\u9876\\u90e8\",\"widgets\":{\"top_nav_202206300003\":{\"title\":\"\\u9876\\u90e8\\u5bfc\\u822a\",\"name\":\"nav\",\"display\":\"1\",\"public_widget_id\":\"top_nav\"}}},\"body_left\":{\"title\":\"\\u4e3b\\u4f53\\u5de6\",\"widgets\":{\"article_202206300003\":{\"title\":\"\\u6587\\u7ae0\\u5185\\u5bb9\",\"name\":\"article\",\"display\":\"1\"},\"article_last_news_202206300003\":{\"title\":\"\\u6700\\u65b0\\u8d44\\u8baf\",\"name\":\"last_news\",\"display\":\"1\"}}},\"body_right\":{\"title\":\"\\u4e3b\\u4f53\\u53f3\",\"widgets\":{\"article_side_hot_articles_202206300004\":{\"title\":\"\\u70ed\\u95e8\\u6587\\u7ae0\",\"name\":\"side_hot_articles\",\"display\":\"1\"},\"article_side_last_articles_202206300004\":{\"title\":\"\\u6700\\u65b0\\u6587\\u7ae0\",\"name\":\"side_last_articles\",\"display\":\"1\"}}},\"footer\":{\"title\":\"\\u5e95\\u90e8\",\"widgets\":{\"footer_202206300003\":{\"title\":\"\\u5e95\\u90e8\",\"name\":\"footer\",\"display\":\"1\",\"public_widget_id\":\"footer\"}}}}}' , `description` = '文章页模板文件' , `is_public` = 0 , `list_order` = '10' WHERE `theme` = 'default' AND `file` = 'portal/article' [ RunTime:0.007792s ]
- SELECT * FROM `cmf_theme_file` WHERE `theme` = 'default' AND `file` = 'portal/blog' LIMIT 1 [ RunTime:0.000240s ]
- UPDATE `cmf_theme_file` SET `theme` = 'default' , `action` = 'portal/Index/index' , `file` = 'portal/blog' , `name` = '首页' , `more` = '{\"widgets_blocks\":{\"top\":{\"title\":\"\\u9876\\u90e8\",\"widgets\":{\"top_nav_202206300003\":{\"title\":\"\\u9876\\u90e8\\u5bfc\\u822a\",\"name\":\"nav\",\"display\":\"1\",\"public_widget_id\":\"top_nav\",\"version\":\"1.0.0\",\"action\":\"\",\"vars\":{\"company_name\":\"ThinkCMF\",\"nav_id\":\"\"}}}},\"body\":{\"title\":\"\\u4e3b\\u4f53\",\"widgets\":{\"home_slider_202206300003\":{\"title\":\"\\u9996\\u9875\\u5e7b\\u706f\\u7247\",\"name\":\"slider\",\"display\":\"1\",\"version\":\"1.0.0\",\"action\":\"\",\"vars\":{\"slide_id\":\"\",\"fullscreen\":1}},\"home_features_202206300003\":{\"title\":\"\\u4ea7\\u54c1\\u7279\\u6027\",\"name\":\"features\",\"display\":\"1\",\"version\":\"1.0.0\",\"action\":\"\",\"vars\":{\"sub_title\":\"Quickly understand the ThinkCMF\",\"features\":[{\"title\":\"MVC\\u5206\\u5c42\\u6a21\\u5f0f\",\"icon\":\"bars\",\"content\":\"\\u4f7f\\u7528MVC\\u5e94\\u7528\\u7a0b\\u5e8f\\u88ab\\u5206\\u6210\\u4e09\\u4e2a\\u6838\\u5fc3\\u90e8\\u4ef6\\uff1a\\u6a21\\u578b\\uff08M\\uff09\\u3001\\u89c6\\u56fe\\uff08V\\uff09\\u3001\\u63a7\\u5236\\u5668\\uff08C\\uff09\\uff0c\\u4ed6\\u4e0d\\u662f\\u4e00\\u4e2a\\u65b0\\u7684\\u6982\\u5ff5\\uff0c\\u53ea\\u662fThinkCMF\\u5c06\\u5176\\u53d1\\u6325\\u5230\\u4e86\\u6781\\u81f4\\u3002\"},{\"title\":\"\\u7528\\u6237\\u7ba1\\u7406\",\"icon\":\"group\",\"content\":\"ThinkCMF\\u5185\\u7f6e\\u4e86\\u7075\\u6d3b\\u7684\\u7528\\u6237\\u7ba1\\u7406\\u65b9\\u5f0f\\uff0c\\u5e76\\u53ef\\u76f4\\u63a5\\u4e0e\\u7b2c\\u4e09\\u65b9\\u7ad9\\u70b9\\u8fdb\\u884c\\u4e92\\u8054\\u4e92\\u901a\\uff0c\\u5982\\u679c\\u4f60\\u613f\\u610f\\u751a\\u81f3\\u53ef\\u4ee5\\u5bf9\\u5355\\u4e2a\\u7528\\u6237\\u6216\\u7fa4\\u4f53\\u7528\\u6237\\u7684\\u884c\\u4e3a\\u8fdb\\u884c\\u8bb0\\u5f55\\u53ca\\u5206\\u4eab\\uff0c\\u4e3a\\u60a8\\u7684\\u8fd0\\u8425\\u51b3\\u7b56\\u63d0\\u4f9b\\u6709\\u6548\\u53c2\\u8003\\u6570\\u636e\\u3002\"},{\"title\":\"\\u4e91\\u7aef\\u90e8\\u7f72\",\"icon\":\"cloud\",\"content\":\"\\u901a\\u8fc7\\u9a71\\u52a8\\u7684\\u65b9\\u5f0f\\u53ef\\u4ee5\\u8f7b\\u677e\\u652f\\u6301\\u4e91\\u5e73\\u53f0\\u7684\\u90e8\\u7f72\\uff0c\\u8ba9\\u4f60\\u7684\\u7f51\\u7ad9\\u65e0\\u7f1d\\u8fc1\\u79fb\\uff0c\\u5185\\u7f6e\\u5df2\\u7ecf\\u652f\\u6301SAE\\u3001BAE\\uff0c\\u6b63\\u5f0f\\u7248\\u5c06\\u5bf9\\u4e91\\u7aef\\u90e8\\u7f72\\u8fdb\\u884c\\u8fdb\\u4e00\\u6b65\\u4f18\\u5316\\u3002\"},{\"title\":\"\\u5b89\\u5168\\u7b56\\u7565\",\"icon\":\"heart\",\"content\":\"\\u63d0\\u4f9b\\u7684\\u7a33\\u5065\\u7684\\u5b89\\u5168\\u7b56\\u7565\\uff0c\\u5305\\u62ec\\u5907\\u4efd\\u6062\\u590d\\uff0c\\u5bb9\\u9519\\uff0c\\u9632\\u6cbb\\u6076\\u610f\\u653b\\u51fb\\u767b\\u9646\\uff0c\\u7f51\\u9875\\u9632\\u7be1\\u6539\\u7b49\\u591a\\u9879\\u5b89\\u5168\\u7ba1\\u7406\\u529f\\u80fd\\uff0c\\u4fdd\\u8bc1\\u7cfb\\u7edf\\u5b89\\u5168\\uff0c\\u53ef\\u9760\\uff0c\\u7a33\\u5b9a\\u7684\\u8fd0\\u884c\\u3002\"},{\"title\":\"\\u5e94\\u7528\\u6a21\\u5757\\u5316\",\"icon\":\"cubes\",\"content\":\"\\u63d0\\u51fa\\u5168\\u65b0\\u7684\\u5e94\\u7528\\u6a21\\u5f0f\\u8fdb\\u884c\\u6269\\u5c55\\uff0c\\u4e0d\\u7ba1\\u662f\\u4f60\\u5f00\\u53d1\\u4e00\\u4e2a\\u5c0f\\u529f\\u80fd\\u8fd8\\u662f\\u4e00\\u4e2a\\u5168\\u65b0\\u7684\\u7ad9\\u70b9\\uff0c\\u5728ThinkCMF\\u4e2d\\u4f60\\u53ea\\u662f\\u589e\\u52a0\\u4e86\\u4e00\\u4e2aAPP\\uff0c\\u6bcf\\u4e2a\\u72ec\\u7acb\\u8fd0\\u884c\\u4e92\\u4e0d\\u5f71\\u54cd\\uff0c\\u4fbf\\u4e8e\\u7075\\u6d3b\\u6269\\u5c55\\u548c\\u4e8c\\u6b21\\u5f00\\u53d1\\u3002\"},{\"title\":\"\\u514d\\u8d39\\u5f00\\u6e90\",\"icon\":\"certificate\",\"content\":\"\\u4ee3\\u7801\\u9075\\u5faaApache2\\u5f00\\u6e90\\u534f\\u8bae\\uff0c\\u514d\\u8d39\\u4f7f\\u7528\\uff0c\\u5bf9\\u5546\\u4e1a\\u7528\\u6237\\u4e5f\\u65e0\\u4efb\\u4f55\\u9650\\u5236\\u3002\"}]}},\"home_last_news_202206300003\":{\"title\":\"\\u6700\\u65b0\\u8d44\\u8baf\",\"name\":\"last_news\",\"display\":\"1\",\"version\":\"1.0.0\",\"action\":\"\",\"vars\":{\"last_news_category_id\":\"\"}},\"home_last_news_202206300004\":{\"title\":\"\\u6700\\u65b0\\u8d44\\u8baf\",\"name\":\"last_news\",\"display\":\"1\",\"version\":\"1.0.0\",\"action\":\"\",\"vars\":{\"last_news_category_id\":\"\"}}}},\"footer\":{\"title\":\"\\u5e95\\u90e8\",\"widgets\":{\"home_footer_202206300003\":{\"title\":\"\\u5e95\\u90e8\",\"name\":\"footer\",\"display\":\"1\",\"public_widget_id\":\"footer\",\"version\":\"1.0.0\",\"action\":\"\",\"vars\":[]}}}}}' , `config_more` = '{\"widgets_blocks\":{\"top\":{\"title\":\"\\u9876\\u90e8\",\"widgets\":{\"top_nav_202206300003\":{\"title\":\"\\u9876\\u90e8\\u5bfc\\u822a\",\"name\":\"nav\",\"display\":\"1\",\"public_widget_id\":\"top_nav\"}}},\"body\":{\"title\":\"\\u4e3b\\u4f53\",\"widgets\":{\"home_slider_202206300003\":{\"title\":\"\\u9996\\u9875\\u5e7b\\u706f\\u7247\",\"name\":\"slider\",\"display\":\"1\"},\"home_features_202206300003\":{\"title\":\"\\u4ea7\\u54c1\\u7279\\u6027\",\"name\":\"features\",\"display\":\"1\"},\"home_last_news_202206300003\":{\"title\":\"\\u6700\\u65b0\\u8d44\\u8baf\",\"name\":\"last_news\",\"display\":\"1\"},\"home_last_news_202206300004\":{\"title\":\"\\u6700\\u65b0\\u8d44\\u8baf\",\"name\":\"last_news\",\"display\":\"1\"}}},\"footer\":{\"title\":\"\\u5e95\\u90e8\",\"widgets\":{\"home_footer_202206300003\":{\"title\":\"\\u5e95\\u90e8\",\"name\":\"footer\",\"display\":\"1\",\"public_widget_id\":\"footer\"}}}}}' , `description` = '首页模板文件' , `is_public` = 0 , `list_order` = '5' WHERE `theme` = 'default' AND `file` = 'portal/blog' [ RunTime:0.008766s ]
- SELECT * FROM `cmf_theme_file` WHERE `theme` = 'default' AND `file` = 'portal/blog_detail' LIMIT 1 [ RunTime:0.000272s ]
- UPDATE `cmf_theme_file` SET `theme` = 'default' , `action` = 'portal/Index/index' , `file` = 'portal/blog_detail' , `name` = '首页' , `more` = '{\"widgets_blocks\":{\"top\":{\"title\":\"\\u9876\\u90e8\",\"widgets\":{\"top_nav_202206300003\":{\"title\":\"\\u9876\\u90e8\\u5bfc\\u822a\",\"name\":\"nav\",\"display\":\"1\",\"public_widget_id\":\"top_nav\",\"version\":\"1.0.0\",\"action\":\"\",\"vars\":{\"company_name\":\"ThinkCMF\",\"nav_id\":\"\"}}}},\"body\":{\"title\":\"\\u4e3b\\u4f53\",\"widgets\":{\"home_slider_202206300003\":{\"title\":\"\\u9996\\u9875\\u5e7b\\u706f\\u7247\",\"name\":\"slider\",\"display\":\"1\",\"version\":\"1.0.0\",\"action\":\"\",\"vars\":{\"slide_id\":\"\",\"fullscreen\":1}},\"home_features_202206300003\":{\"title\":\"\\u4ea7\\u54c1\\u7279\\u6027\",\"name\":\"features\",\"display\":\"1\",\"version\":\"1.0.0\",\"action\":\"\",\"vars\":{\"sub_title\":\"Quickly understand the ThinkCMF\",\"features\":[{\"title\":\"MVC\\u5206\\u5c42\\u6a21\\u5f0f\",\"icon\":\"bars\",\"content\":\"\\u4f7f\\u7528MVC\\u5e94\\u7528\\u7a0b\\u5e8f\\u88ab\\u5206\\u6210\\u4e09\\u4e2a\\u6838\\u5fc3\\u90e8\\u4ef6\\uff1a\\u6a21\\u578b\\uff08M\\uff09\\u3001\\u89c6\\u56fe\\uff08V\\uff09\\u3001\\u63a7\\u5236\\u5668\\uff08C\\uff09\\uff0c\\u4ed6\\u4e0d\\u662f\\u4e00\\u4e2a\\u65b0\\u7684\\u6982\\u5ff5\\uff0c\\u53ea\\u662fThinkCMF\\u5c06\\u5176\\u53d1\\u6325\\u5230\\u4e86\\u6781\\u81f4\\u3002\"},{\"title\":\"\\u7528\\u6237\\u7ba1\\u7406\",\"icon\":\"group\",\"content\":\"ThinkCMF\\u5185\\u7f6e\\u4e86\\u7075\\u6d3b\\u7684\\u7528\\u6237\\u7ba1\\u7406\\u65b9\\u5f0f\\uff0c\\u5e76\\u53ef\\u76f4\\u63a5\\u4e0e\\u7b2c\\u4e09\\u65b9\\u7ad9\\u70b9\\u8fdb\\u884c\\u4e92\\u8054\\u4e92\\u901a\\uff0c\\u5982\\u679c\\u4f60\\u613f\\u610f\\u751a\\u81f3\\u53ef\\u4ee5\\u5bf9\\u5355\\u4e2a\\u7528\\u6237\\u6216\\u7fa4\\u4f53\\u7528\\u6237\\u7684\\u884c\\u4e3a\\u8fdb\\u884c\\u8bb0\\u5f55\\u53ca\\u5206\\u4eab\\uff0c\\u4e3a\\u60a8\\u7684\\u8fd0\\u8425\\u51b3\\u7b56\\u63d0\\u4f9b\\u6709\\u6548\\u53c2\\u8003\\u6570\\u636e\\u3002\"},{\"title\":\"\\u4e91\\u7aef\\u90e8\\u7f72\",\"icon\":\"cloud\",\"content\":\"\\u901a\\u8fc7\\u9a71\\u52a8\\u7684\\u65b9\\u5f0f\\u53ef\\u4ee5\\u8f7b\\u677e\\u652f\\u6301\\u4e91\\u5e73\\u53f0\\u7684\\u90e8\\u7f72\\uff0c\\u8ba9\\u4f60\\u7684\\u7f51\\u7ad9\\u65e0\\u7f1d\\u8fc1\\u79fb\\uff0c\\u5185\\u7f6e\\u5df2\\u7ecf\\u652f\\u6301SAE\\u3001BAE\\uff0c\\u6b63\\u5f0f\\u7248\\u5c06\\u5bf9\\u4e91\\u7aef\\u90e8\\u7f72\\u8fdb\\u884c\\u8fdb\\u4e00\\u6b65\\u4f18\\u5316\\u3002\"},{\"title\":\"\\u5b89\\u5168\\u7b56\\u7565\",\"icon\":\"heart\",\"content\":\"\\u63d0\\u4f9b\\u7684\\u7a33\\u5065\\u7684\\u5b89\\u5168\\u7b56\\u7565\\uff0c\\u5305\\u62ec\\u5907\\u4efd\\u6062\\u590d\\uff0c\\u5bb9\\u9519\\uff0c\\u9632\\u6cbb\\u6076\\u610f\\u653b\\u51fb\\u767b\\u9646\\uff0c\\u7f51\\u9875\\u9632\\u7be1\\u6539\\u7b49\\u591a\\u9879\\u5b89\\u5168\\u7ba1\\u7406\\u529f\\u80fd\\uff0c\\u4fdd\\u8bc1\\u7cfb\\u7edf\\u5b89\\u5168\\uff0c\\u53ef\\u9760\\uff0c\\u7a33\\u5b9a\\u7684\\u8fd0\\u884c\\u3002\"},{\"title\":\"\\u5e94\\u7528\\u6a21\\u5757\\u5316\",\"icon\":\"cubes\",\"content\":\"\\u63d0\\u51fa\\u5168\\u65b0\\u7684\\u5e94\\u7528\\u6a21\\u5f0f\\u8fdb\\u884c\\u6269\\u5c55\\uff0c\\u4e0d\\u7ba1\\u662f\\u4f60\\u5f00\\u53d1\\u4e00\\u4e2a\\u5c0f\\u529f\\u80fd\\u8fd8\\u662f\\u4e00\\u4e2a\\u5168\\u65b0\\u7684\\u7ad9\\u70b9\\uff0c\\u5728ThinkCMF\\u4e2d\\u4f60\\u53ea\\u662f\\u589e\\u52a0\\u4e86\\u4e00\\u4e2aAPP\\uff0c\\u6bcf\\u4e2a\\u72ec\\u7acb\\u8fd0\\u884c\\u4e92\\u4e0d\\u5f71\\u54cd\\uff0c\\u4fbf\\u4e8e\\u7075\\u6d3b\\u6269\\u5c55\\u548c\\u4e8c\\u6b21\\u5f00\\u53d1\\u3002\"},{\"title\":\"\\u514d\\u8d39\\u5f00\\u6e90\",\"icon\":\"certificate\",\"content\":\"\\u4ee3\\u7801\\u9075\\u5faaApache2\\u5f00\\u6e90\\u534f\\u8bae\\uff0c\\u514d\\u8d39\\u4f7f\\u7528\\uff0c\\u5bf9\\u5546\\u4e1a\\u7528\\u6237\\u4e5f\\u65e0\\u4efb\\u4f55\\u9650\\u5236\\u3002\"}]}},\"home_last_news_202206300003\":{\"title\":\"\\u6700\\u65b0\\u8d44\\u8baf\",\"name\":\"last_news\",\"display\":\"1\",\"version\":\"1.0.0\",\"action\":\"\",\"vars\":{\"last_news_category_id\":\"\"}},\"home_last_news_202206300004\":{\"title\":\"\\u6700\\u65b0\\u8d44\\u8baf\",\"name\":\"last_news\",\"display\":\"1\",\"version\":\"1.0.0\",\"action\":\"\",\"vars\":{\"last_news_category_id\":\"\"}}}},\"footer\":{\"title\":\"\\u5e95\\u90e8\",\"widgets\":{\"home_footer_202206300003\":{\"title\":\"\\u5e95\\u90e8\",\"name\":\"footer\",\"display\":\"1\",\"public_widget_id\":\"footer\",\"version\":\"1.0.0\",\"action\":\"\",\"vars\":[]}}}}}' , `config_more` = '{\"widgets_blocks\":{\"top\":{\"title\":\"\\u9876\\u90e8\",\"widgets\":{\"top_nav_202206300003\":{\"title\":\"\\u9876\\u90e8\\u5bfc\\u822a\",\"name\":\"nav\",\"display\":\"1\",\"public_widget_id\":\"top_nav\"}}},\"body\":{\"title\":\"\\u4e3b\\u4f53\",\"widgets\":{\"home_slider_202206300003\":{\"title\":\"\\u9996\\u9875\\u5e7b\\u706f\\u7247\",\"name\":\"slider\",\"display\":\"1\"},\"home_features_202206300003\":{\"title\":\"\\u4ea7\\u54c1\\u7279\\u6027\",\"name\":\"features\",\"display\":\"1\"},\"home_last_news_202206300003\":{\"title\":\"\\u6700\\u65b0\\u8d44\\u8baf\",\"name\":\"last_news\",\"display\":\"1\"},\"home_last_news_202206300004\":{\"title\":\"\\u6700\\u65b0\\u8d44\\u8baf\",\"name\":\"last_news\",\"display\":\"1\"}}},\"footer\":{\"title\":\"\\u5e95\\u90e8\",\"widgets\":{\"home_footer_202206300003\":{\"title\":\"\\u5e95\\u90e8\",\"name\":\"footer\",\"display\":\"1\",\"public_widget_id\":\"footer\"}}}}}' , `description` = '首页模板文件' , `is_public` = 0 , `list_order` = '5' WHERE `theme` = 'default' AND `file` = 'portal/blog_detail' [ RunTime:0.005920s ]
- SELECT * FROM `cmf_theme_file` WHERE `theme` = 'default' AND `file` = 'portal/category' LIMIT 1 [ RunTime:0.000288s ]
- UPDATE `cmf_theme_file` SET `theme` = 'default' , `action` = 'portal/Index/index' , `file` = 'portal/category' , `name` = '首页' , `more` = '{\"widgets_blocks\":{\"top\":{\"title\":\"\\u9876\\u90e8\",\"widgets\":{\"top_nav_202206300003\":{\"title\":\"\\u9876\\u90e8\\u5bfc\\u822a\",\"name\":\"nav\",\"display\":1,\"public_widget_id\":\"top_nav\",\"version\":\"1.0.0\",\"action\":\"\",\"vars\":{\"company_name\":\"ThinkCMF\",\"nav_id\":\"1\"},\"css\":{\"margin-top\":\"0\",\"margin-bottom\":\"15px\",\"margin-left\":\"0\",\"margin-right\":\"0\"}}}},\"body\":{\"title\":\"\\u4e3b\\u4f53\",\"widgets\":{\"home_slider_202206300003\":{\"title\":\"name\",\"name\":\"slider\",\"display\":1,\"version\":\"1.0.0\",\"action\":\"\",\"vars\":{\"slide_id\":31,\"fullscreen\":1},\"css\":{\"margin-top\":0,\"margin-bottom\":0,\"margin-left\":0,\"margin-right\":0}}}},\"footer\":{\"title\":\"\\u5e95\\u90e8\",\"widgets\":{\"home_footer_202206300003\":{\"title\":\"\\u5e95\\u90e8\",\"name\":\"footer\",\"display\":\"1\",\"public_widget_id\":\"footer\",\"version\":\"1.0.0\",\"action\":\"\",\"vars\":[]}}}}}' , `config_more` = '{\"widgets_blocks\":{\"top\":{\"title\":\"\\u9876\\u90e8\",\"widgets\":{\"top_nav_202206300003\":{\"title\":\"\\u9876\\u90e8\\u5bfc\\u822a\",\"name\":\"nav\",\"display\":\"1\",\"public_widget_id\":\"top_nav\"}}},\"body\":{\"title\":\"\\u4e3b\\u4f53\",\"widgets\":{\"home_slider_202206300003\":{\"title\":\"name\",\"name\":\"slider\",\"display\":1,\"version\":\"1.0.0\",\"action\":\"\",\"vars\":{\"slide_id\":31,\"fullscreen\":1},\"css\":{\"margin-top\":0,\"margin-bottom\":0,\"margin-left\":0,\"margin-right\":0}}}},\"footer\":{\"title\":\"\\u5e95\\u90e8\",\"widgets\":{\"home_footer_202206300003\":{\"title\":\"\\u5e95\\u90e8\",\"name\":\"footer\",\"display\":\"1\",\"public_widget_id\":\"footer\"}}}}}' , `description` = '首页模板文件' , `is_public` = 0 , `list_order` = '5' WHERE `theme` = 'default' AND `file` = 'portal/category' [ RunTime:0.006491s ]
- SELECT * FROM `cmf_theme_file` WHERE `theme` = 'default' AND `file` = 'portal/contact' LIMIT 1 [ RunTime:0.000261s ]
- UPDATE `cmf_theme_file` SET `theme` = 'default' , `action` = 'portal/Page/index' , `file` = 'portal/contact' , `name` = '联系我们页' , `more` = '{\"widgets_blocks\":{\"top\":{\"title\":\"\\u9876\\u90e8\",\"widgets\":{\"top_nav_202206300003\":{\"title\":\"\\u9876\\u90e8\\u5bfc\\u822a\",\"name\":\"nav\",\"display\":\"1\",\"public_widget_id\":\"top_nav\",\"version\":\"1.0.0\",\"action\":\"\",\"vars\":{\"company_name\":\"ThinkCMF\",\"nav_id\":\"\"}}}},\"body\":{\"title\":\"\\u4e3b\\u4f53\",\"widgets\":{\"contact_map_202206300003\":{\"title\":\"\\u8054\\u7cfb\\u5730\\u56fe\",\"name\":\"tianditu_contact\",\"display\":\"1\",\"version\":\"1.0.0\",\"action\":\"\",\"vars\":{\"map_secret_key\":\"\",\"map_info_window_text\":\"ThinkCMF<br\\/><span class=\'\'>\\u5730\\u5740\\uff1a\\u4e0a\\u6d77\\u5e02\\u5f90\\u6c47\\u533a\\u659c\\u571f\\u8def2601\\u53f7<\\/span>\",\"map_info_window_rich_text\":\"ThinkCMF<br\\/><span class=\'\'>\\u5730\\u5740\\uff1a\\u4e0a\\u6d77\\u5e02\\u5f90\\u6c47\\u533a\\u659c\\u571f\\u8def2601\\u53f7<\\/span>\",\"map_info_window_rich_text2\":\"ThinkCMF<br\\/><span class=\'\'>\\u5730\\u5740\\uff1a\\u4e0a\\u6d77\\u5e02\\u5f90\\u6c47\\u533a\\u659c\\u571f\\u8def2601\\u53f7<\\/span>\",\"company_location\":\"\",\"fullscreen\":1}},\"contact_guestbook_202206300003\":{\"title\":\"\\u5ba2\\u6237\\u8054\\u7cfb\",\"name\":\"guestbook\",\"display\":\"1\",\"version\":\"1.0.0\",\"action\":\"\",\"vars\":{\"address_cn\":\"\\u4e0a\\u6d77\\u5e02\\u5f90\\u6c47\\u533a\\u659c\\u571f\\u8def0001\\u53f7\",\"address_en\":\"NO.0001 Xie Tu Road, Shanghai China\",\"email\":\"catman@thinkcmf.com\",\"phone_cn\":\"021 1000 0001\",\"phone_en\":\"+8621 1000 0001\",\"qq\":\"478519726\"}}}},\"footer\":{\"title\":\"\\u5e95\\u90e8\",\"widgets\":{\"contact_footer_202206300003\":{\"title\":\"\\u5e95\\u90e8\",\"name\":\"footer\",\"display\":\"1\",\"public_widget_id\":\"footer\",\"version\":\"1.0.0\",\"action\":\"\",\"vars\":[]}}}}}' , `config_more` = '{\"widgets_blocks\":{\"top\":{\"title\":\"\\u9876\\u90e8\",\"widgets\":{\"top_nav_202206300003\":{\"title\":\"\\u9876\\u90e8\\u5bfc\\u822a\",\"name\":\"nav\",\"display\":\"1\",\"public_widget_id\":\"top_nav\"}}},\"body\":{\"title\":\"\\u4e3b\\u4f53\",\"widgets\":{\"contact_map_202206300003\":{\"title\":\"\\u8054\\u7cfb\\u5730\\u56fe\",\"name\":\"tianditu_contact\",\"display\":\"1\"},\"contact_guestbook_202206300003\":{\"title\":\"\\u5ba2\\u6237\\u8054\\u7cfb\",\"name\":\"guestbook\",\"display\":\"1\"}}},\"footer\":{\"title\":\"\\u5e95\\u90e8\",\"widgets\":{\"contact_footer_202206300003\":{\"title\":\"\\u5e95\\u90e8\",\"name\":\"footer\",\"display\":\"1\",\"public_widget_id\":\"footer\"}}}}}' , `description` = '联系我们页模板文件' , `is_public` = 0 , `list_order` = '10' WHERE `theme` = 'default' AND `file` = 'portal/contact' [ RunTime:0.004937s ]
- SELECT * FROM `cmf_theme_file` WHERE `theme` = 'default' AND `file` = 'portal/index' LIMIT 1 [ RunTime:0.000222s ]
- UPDATE `cmf_theme_file` SET `theme` = 'default' , `action` = 'portal/Index/index' , `file` = 'portal/index' , `name` = '首页' , `more` = '{\"widgets_blocks\":{\"top\":{\"title\":\"\\u9876\\u90e8\",\"widgets\":{\"top_nav_202206300003\":{\"title\":\"\\u9876\\u90e8\\u5bfc\\u822a\",\"name\":\"nav\",\"display\":\"1\",\"public_widget_id\":\"top_nav\",\"version\":\"1.0.0\",\"action\":\"\",\"vars\":{\"company_name\":\"ThinkCMF\",\"nav_id\":\"\"}}}},\"body\":{\"title\":\"\\u4e3b\\u4f53\",\"widgets\":{\"home_slider_202206300003\":{\"title\":\"name\",\"name\":\"slider\",\"display\":1,\"version\":\"1.0.0\",\"action\":\"\",\"vars\":{\"slide_id\":\"32\",\"fullscreen\":1},\"css\":{\"margin-top\":0,\"margin-bottom\":0,\"margin-left\":0,\"margin-right\":0}}}},\"footer\":{\"title\":\"\\u5e95\\u90e8\",\"widgets\":{\"home_footer_202206300003\":{\"title\":\"\\u5e95\\u90e8\",\"name\":\"footer\",\"display\":\"1\",\"public_widget_id\":\"footer\",\"version\":\"1.0.0\",\"action\":\"\",\"vars\":[]}}}}}' , `config_more` = '{\"widgets_blocks\":{\"top\":{\"title\":\"\\u9876\\u90e8\",\"widgets\":{\"top_nav_202206300003\":{\"title\":\"\\u9876\\u90e8\\u5bfc\\u822a\",\"name\":\"nav\",\"display\":\"1\",\"public_widget_id\":\"top_nav\"}}},\"body\":{\"title\":\"\\u4e3b\\u4f53\",\"widgets\":{\"home_slider_202206300003\":{\"title\":\"name\",\"name\":\"slider\",\"display\":1,\"version\":\"1.0.0\",\"action\":\"\",\"vars\":{\"slide_id\":\"32\",\"fullscreen\":1},\"css\":{\"margin-top\":0,\"margin-bottom\":0,\"margin-left\":0,\"margin-right\":0}}}},\"footer\":{\"title\":\"\\u5e95\\u90e8\",\"widgets\":{\"home_footer_202206300003\":{\"title\":\"\\u5e95\\u90e8\",\"name\":\"footer\",\"display\":\"1\",\"public_widget_id\":\"footer\"}}}}}' , `description` = '首页模板文件' , `is_public` = 0 , `list_order` = '5' WHERE `theme` = 'default' AND `file` = 'portal/index' [ RunTime:0.005212s ]
- SELECT * FROM `cmf_theme_file` WHERE `theme` = 'default' AND `file` = 'portal/list' LIMIT 1 [ RunTime:0.000205s ]
- UPDATE `cmf_theme_file` SET `theme` = 'default' , `action` = 'portal/Product/category' , `file` = 'portal/list' , `name` = '文章列表页' , `more` = '{\"widgets_blocks\":{\"top\":{\"title\":\"\\u9876\\u90e8\",\"widgets\":{\"top_nav_202206300003\":{\"title\":\"\\u9876\\u90e8\\u5bfc\\u822a\",\"name\":\"nav\",\"display\":\"1\",\"public_widget_id\":\"top_nav\",\"version\":\"1.0.0\",\"action\":\"\",\"vars\":{\"company_name\":\"ThinkCMF\",\"nav_id\":\"\"}}}},\"body_left\":{\"title\":\"\\u4e3b\\u4f53\\u5de6\",\"widgets\":{\"list_articles_202206300003\":{\"title\":\"\\u6587\\u7ae0\\u5217\\u8868\",\"name\":\"list_articles\",\"display\":\"1\",\"version\":\"1.0.0\",\"action\":\"portal\\/List\\/index\",\"vars\":[]},\"list_last_news_202206300003\":{\"title\":\"\\u6700\\u65b0\\u8d44\\u8baf\",\"name\":\"last_news\",\"display\":\"1\",\"version\":\"1.0.0\",\"action\":\"\",\"vars\":{\"last_news_category_id\":\"\"}}}},\"body_right\":{\"title\":\"\\u4e3b\\u4f53\\u53f3\",\"widgets\":{\"list_side_hot_articles_202206300004\":{\"title\":\"\\u70ed\\u95e8\\u6587\\u7ae0\",\"name\":\"side_hot_articles\",\"display\":\"1\",\"version\":\"1.0.0\",\"action\":\"\",\"vars\":{\"hottest_articles_category_id\":\"\"}},\"list_side_last_articles_202206300004\":{\"title\":\"\\u6700\\u65b0\\u6587\\u7ae0\",\"name\":\"side_last_articles\",\"display\":\"1\",\"version\":\"1.0.0\",\"action\":\"\",\"vars\":{\"last_articles_category_id\":\"\"}}}},\"footer\":{\"title\":\"\\u5e95\\u90e8\",\"widgets\":{\"home_footer_202206300003\":{\"title\":\"\\u5e95\\u90e8\",\"name\":\"footer\",\"display\":\"1\",\"public_widget_id\":\"footer\",\"version\":\"1.0.0\",\"action\":\"\",\"vars\":[]}}}}}' , `config_more` = '{\"widgets_blocks\":{\"top\":{\"title\":\"\\u9876\\u90e8\",\"widgets\":{\"top_nav_202206300003\":{\"title\":\"\\u9876\\u90e8\\u5bfc\\u822a\",\"name\":\"nav\",\"display\":\"1\",\"public_widget_id\":\"top_nav\"}}},\"body_left\":{\"title\":\"\\u4e3b\\u4f53\\u5de6\",\"widgets\":{\"list_articles_202206300003\":{\"title\":\"\\u6587\\u7ae0\\u5217\\u8868\",\"name\":\"list_articles\",\"display\":\"1\"},\"list_last_news_202206300003\":{\"title\":\"\\u6700\\u65b0\\u8d44\\u8baf\",\"name\":\"last_news\",\"display\":\"1\"}}},\"body_right\":{\"title\":\"\\u4e3b\\u4f53\\u53f3\",\"widgets\":{\"list_side_hot_articles_202206300004\":{\"title\":\"\\u70ed\\u95e8\\u6587\\u7ae0\",\"name\":\"side_hot_articles\",\"display\":\"1\"},\"list_side_last_articles_202206300004\":{\"title\":\"\\u6700\\u65b0\\u6587\\u7ae0\",\"name\":\"side_last_articles\",\"display\":\"1\"}}},\"footer\":{\"title\":\"\\u5e95\\u90e8\",\"widgets\":{\"home_footer_202206300003\":{\"title\":\"\\u5e95\\u90e8\",\"name\":\"footer\",\"display\":\"1\",\"public_widget_id\":\"footer\"}}}}}' , `description` = '文章列表模板文件' , `is_public` = 0 , `list_order` = '10' WHERE `theme` = 'default' AND `file` = 'portal/list' [ RunTime:0.004982s ]
- SELECT * FROM `cmf_theme_file` WHERE `theme` = 'default' AND `file` = 'portal/list_filter' LIMIT 1 [ RunTime:0.000224s ]
- UPDATE `cmf_theme_file` SET `theme` = 'default' , `action` = 'portal/List/index' , `file` = 'portal/list_filter' , `name` = '文章带过滤器列表页' , `more` = '{\"widgets_blocks\":{\"top\":{\"title\":\"\\u9876\\u90e8\",\"widgets\":{\"top_nav_202206300003\":{\"title\":\"\\u9876\\u90e8\\u5bfc\\u822a\",\"name\":\"nav\",\"display\":\"1\",\"public_widget_id\":\"top_nav\",\"version\":\"1.0.0\",\"action\":\"\",\"vars\":{\"company_name\":\"ThinkCMF\",\"nav_id\":\"\"}}}},\"body_left\":{\"title\":\"\\u4e3b\\u4f53\\u5de6\",\"widgets\":{\"list_articles_202206300003\":{\"title\":\"\\u6587\\u7ae0\\u5217\\u8868\",\"name\":\"list_filter_articles\",\"display\":\"1\",\"version\":\"1.0.0\",\"action\":\"portal\\/List\\/index\",\"vars\":[]},\"list_last_news_202206300003\":{\"title\":\"\\u6700\\u65b0\\u8d44\\u8baf\",\"name\":\"last_news\",\"display\":\"1\",\"version\":\"1.0.0\",\"action\":\"\",\"vars\":{\"last_news_category_id\":\"\"}}}},\"body_right\":{\"title\":\"\\u4e3b\\u4f53\\u53f3\",\"widgets\":{\"list_side_hot_articles_202206300004\":{\"title\":\"\\u70ed\\u95e8\\u6587\\u7ae0\",\"name\":\"side_hot_articles\",\"display\":\"1\",\"version\":\"1.0.0\",\"action\":\"\",\"vars\":{\"hottest_articles_category_id\":\"\"}},\"list_side_last_articles_202206300004\":{\"title\":\"\\u6700\\u65b0\\u6587\\u7ae0\",\"name\":\"side_last_articles\",\"display\":\"1\",\"version\":\"1.0.0\",\"action\":\"\",\"vars\":{\"last_articles_category_id\":\"\"}}}},\"footer\":{\"title\":\"\\u5e95\\u90e8\",\"widgets\":{\"home_footer_202206300003\":{\"title\":\"\\u5e95\\u90e8\",\"name\":\"footer\",\"display\":\"1\",\"public_widget_id\":\"footer\",\"version\":\"1.0.0\",\"action\":\"\",\"vars\":[]}}}}}' , `config_more` = '{\"widgets_blocks\":{\"top\":{\"title\":\"\\u9876\\u90e8\",\"widgets\":{\"top_nav_202206300003\":{\"title\":\"\\u9876\\u90e8\\u5bfc\\u822a\",\"name\":\"nav\",\"display\":\"1\",\"public_widget_id\":\"top_nav\"}}},\"body_left\":{\"title\":\"\\u4e3b\\u4f53\\u5de6\",\"widgets\":{\"list_articles_202206300003\":{\"title\":\"\\u6587\\u7ae0\\u5217\\u8868\",\"name\":\"list_filter_articles\",\"display\":\"1\"},\"list_last_news_202206300003\":{\"title\":\"\\u6700\\u65b0\\u8d44\\u8baf\",\"name\":\"last_news\",\"display\":\"1\"}}},\"body_right\":{\"title\":\"\\u4e3b\\u4f53\\u53f3\",\"widgets\":{\"list_side_hot_articles_202206300004\":{\"title\":\"\\u70ed\\u95e8\\u6587\\u7ae0\",\"name\":\"side_hot_articles\",\"display\":\"1\"},\"list_side_last_articles_202206300004\":{\"title\":\"\\u6700\\u65b0\\u6587\\u7ae0\",\"name\":\"side_last_articles\",\"display\":\"1\"}}},\"footer\":{\"title\":\"\\u5e95\\u90e8\",\"widgets\":{\"home_footer_202206300003\":{\"title\":\"\\u5e95\\u90e8\",\"name\":\"footer\",\"display\":\"1\",\"public_widget_id\":\"footer\"}}}}}' , `description` = '文章列表模板文件' , `is_public` = 0 , `list_order` = '10' WHERE `theme` = 'default' AND `file` = 'portal/list_filter' [ RunTime:0.008103s ]
- SELECT * FROM `cmf_theme_file` WHERE `theme` = 'default' AND `file` = 'portal/page' LIMIT 1 [ RunTime:0.000190s ]
- UPDATE `cmf_theme_file` SET `theme` = 'default' , `action` = 'portal/Page/index' , `file` = 'portal/page' , `name` = '单页面' , `more` = '{\"widgets_blocks\":{\"top\":{\"title\":\"\\u9876\\u90e8\",\"widgets\":{\"top_nav_202206300003\":{\"title\":\"\\u9876\\u90e8\\u5bfc\\u822a\",\"name\":\"nav\",\"display\":\"1\",\"public_widget_id\":\"top_nav\",\"version\":\"1.0.0\",\"action\":\"\",\"vars\":{\"company_name\":\"ThinkCMF\",\"nav_id\":\"\"}}}},\"body_left\":{\"title\":\"\\u4e3b\\u4f53\\u5de6\",\"widgets\":{\"page_202206300003\":{\"title\":\"\\u9875\\u9762\\u5185\\u5bb9\",\"name\":\"page\",\"display\":\"1\",\"version\":\"1.0.0\",\"action\":\"portal\\/Page\\/index\",\"vars\":[]}}},\"body_right\":{\"title\":\"\\u4e3b\\u4f53\\u53f3\",\"widgets\":{\"page_side_hot_articles_202206300004\":{\"title\":\"\\u70ed\\u95e8\\u6587\\u7ae0\",\"name\":\"side_hot_articles\",\"display\":\"1\",\"version\":\"1.0.0\",\"action\":\"\",\"vars\":{\"hottest_articles_category_id\":\"\"}},\"page_side_last_articles_202206300004\":{\"title\":\"\\u6700\\u65b0\\u6587\\u7ae0\",\"name\":\"side_last_articles\",\"display\":\"1\",\"version\":\"1.0.0\",\"action\":\"\",\"vars\":{\"last_articles_category_id\":\"\"}}}},\"footer\":{\"title\":\"\\u5e95\\u90e8\",\"widgets\":{\"footer_202206300003\":{\"title\":\"\\u5e95\\u90e8\",\"name\":\"footer\",\"display\":\"1\",\"public_widget_id\":\"footer\",\"version\":\"1.0.0\",\"action\":\"\",\"vars\":{\"company_name\":\"ThinkCMF\",\"nav_id\":\"2\"}}}}},\"edited_by_designer\":1}' , `config_more` = '{\"widgets_blocks\":{\"top\":{\"title\":\"\\u9876\\u90e8\",\"widgets\":{\"top_nav_202206300003\":{\"title\":\"\\u9876\\u90e8\\u5bfc\\u822a\",\"name\":\"nav\",\"display\":\"1\",\"public_widget_id\":\"top_nav\"}}},\"body_left\":{\"title\":\"\\u4e3b\\u4f53\\u5de6\",\"widgets\":{\"page_202206300003\":{\"title\":\"\\u9875\\u9762\\u5185\\u5bb9\",\"name\":\"page\",\"display\":\"1\"},\"page_last_news_202206300003\":{\"title\":\"\\u6700\\u65b0\\u8d44\\u8baf1\",\"name\":\"last_news\",\"display\":\"0\"}}},\"body_right\":{\"title\":\"\\u4e3b\\u4f53\\u53f3\",\"widgets\":{\"page_side_hot_articles_202206300004\":{\"title\":\"\\u70ed\\u95e8\\u6587\\u7ae0\",\"name\":\"side_hot_articles\",\"display\":\"1\"},\"page_side_last_articles_202206300004\":{\"title\":\"\\u6700\\u65b0\\u6587\\u7ae0\",\"name\":\"side_last_articles\",\"display\":\"1\"}}},\"footer\":{\"title\":\"\\u5e95\\u90e8\",\"widgets\":{\"footer_202206300003\":{\"title\":\"\\u5e95\\u90e8\",\"name\":\"footer\",\"display\":\"1\",\"public_widget_id\":\"footer\"}}}}}' , `description` = '单页面模板文件' , `is_public` = 0 , `list_order` = '10' WHERE `theme` = 'default' AND `file` = 'portal/page' [ RunTime:0.010201s ]
- SELECT * FROM `cmf_theme_file` WHERE `theme` = 'default' AND `file` = 'portal/product' LIMIT 1 [ RunTime:0.000254s ]
- UPDATE `cmf_theme_file` SET `theme` = 'default' , `action` = 'portal/Index/index' , `file` = 'portal/product' , `name` = '首页' , `more` = '{\"widgets_blocks\":{\"top\":{\"title\":\"\\u9876\\u90e8\",\"widgets\":{\"top_nav_202206300003\":{\"title\":\"\\u9876\\u90e8\\u5bfc\\u822a\",\"name\":\"nav\",\"display\":\"1\",\"public_widget_id\":\"top_nav\",\"version\":\"1.0.0\",\"action\":\"\",\"vars\":{\"company_name\":\"ThinkCMF\",\"nav_id\":\"\"}}}},\"body\":{\"title\":\"\\u4e3b\\u4f53\",\"widgets\":{\"home_slider_202206300003\":{\"title\":\"\\u9996\\u9875\\u5e7b\\u706f\\u7247\",\"name\":\"slider\",\"display\":\"1\",\"version\":\"1.0.0\",\"action\":\"\",\"vars\":{\"slide_id\":\"\",\"fullscreen\":1}},\"home_features_202206300003\":{\"title\":\"\\u4ea7\\u54c1\\u7279\\u6027\",\"name\":\"features\",\"display\":\"1\",\"version\":\"1.0.0\",\"action\":\"\",\"vars\":{\"sub_title\":\"Quickly understand the ThinkCMF\",\"features\":[{\"title\":\"MVC\\u5206\\u5c42\\u6a21\\u5f0f\",\"icon\":\"bars\",\"content\":\"\\u4f7f\\u7528MVC\\u5e94\\u7528\\u7a0b\\u5e8f\\u88ab\\u5206\\u6210\\u4e09\\u4e2a\\u6838\\u5fc3\\u90e8\\u4ef6\\uff1a\\u6a21\\u578b\\uff08M\\uff09\\u3001\\u89c6\\u56fe\\uff08V\\uff09\\u3001\\u63a7\\u5236\\u5668\\uff08C\\uff09\\uff0c\\u4ed6\\u4e0d\\u662f\\u4e00\\u4e2a\\u65b0\\u7684\\u6982\\u5ff5\\uff0c\\u53ea\\u662fThinkCMF\\u5c06\\u5176\\u53d1\\u6325\\u5230\\u4e86\\u6781\\u81f4\\u3002\"},{\"title\":\"\\u7528\\u6237\\u7ba1\\u7406\",\"icon\":\"group\",\"content\":\"ThinkCMF\\u5185\\u7f6e\\u4e86\\u7075\\u6d3b\\u7684\\u7528\\u6237\\u7ba1\\u7406\\u65b9\\u5f0f\\uff0c\\u5e76\\u53ef\\u76f4\\u63a5\\u4e0e\\u7b2c\\u4e09\\u65b9\\u7ad9\\u70b9\\u8fdb\\u884c\\u4e92\\u8054\\u4e92\\u901a\\uff0c\\u5982\\u679c\\u4f60\\u613f\\u610f\\u751a\\u81f3\\u53ef\\u4ee5\\u5bf9\\u5355\\u4e2a\\u7528\\u6237\\u6216\\u7fa4\\u4f53\\u7528\\u6237\\u7684\\u884c\\u4e3a\\u8fdb\\u884c\\u8bb0\\u5f55\\u53ca\\u5206\\u4eab\\uff0c\\u4e3a\\u60a8\\u7684\\u8fd0\\u8425\\u51b3\\u7b56\\u63d0\\u4f9b\\u6709\\u6548\\u53c2\\u8003\\u6570\\u636e\\u3002\"},{\"title\":\"\\u4e91\\u7aef\\u90e8\\u7f72\",\"icon\":\"cloud\",\"content\":\"\\u901a\\u8fc7\\u9a71\\u52a8\\u7684\\u65b9\\u5f0f\\u53ef\\u4ee5\\u8f7b\\u677e\\u652f\\u6301\\u4e91\\u5e73\\u53f0\\u7684\\u90e8\\u7f72\\uff0c\\u8ba9\\u4f60\\u7684\\u7f51\\u7ad9\\u65e0\\u7f1d\\u8fc1\\u79fb\\uff0c\\u5185\\u7f6e\\u5df2\\u7ecf\\u652f\\u6301SAE\\u3001BAE\\uff0c\\u6b63\\u5f0f\\u7248\\u5c06\\u5bf9\\u4e91\\u7aef\\u90e8\\u7f72\\u8fdb\\u884c\\u8fdb\\u4e00\\u6b65\\u4f18\\u5316\\u3002\"},{\"title\":\"\\u5b89\\u5168\\u7b56\\u7565\",\"icon\":\"heart\",\"content\":\"\\u63d0\\u4f9b\\u7684\\u7a33\\u5065\\u7684\\u5b89\\u5168\\u7b56\\u7565\\uff0c\\u5305\\u62ec\\u5907\\u4efd\\u6062\\u590d\\uff0c\\u5bb9\\u9519\\uff0c\\u9632\\u6cbb\\u6076\\u610f\\u653b\\u51fb\\u767b\\u9646\\uff0c\\u7f51\\u9875\\u9632\\u7be1\\u6539\\u7b49\\u591a\\u9879\\u5b89\\u5168\\u7ba1\\u7406\\u529f\\u80fd\\uff0c\\u4fdd\\u8bc1\\u7cfb\\u7edf\\u5b89\\u5168\\uff0c\\u53ef\\u9760\\uff0c\\u7a33\\u5b9a\\u7684\\u8fd0\\u884c\\u3002\"},{\"title\":\"\\u5e94\\u7528\\u6a21\\u5757\\u5316\",\"icon\":\"cubes\",\"content\":\"\\u63d0\\u51fa\\u5168\\u65b0\\u7684\\u5e94\\u7528\\u6a21\\u5f0f\\u8fdb\\u884c\\u6269\\u5c55\\uff0c\\u4e0d\\u7ba1\\u662f\\u4f60\\u5f00\\u53d1\\u4e00\\u4e2a\\u5c0f\\u529f\\u80fd\\u8fd8\\u662f\\u4e00\\u4e2a\\u5168\\u65b0\\u7684\\u7ad9\\u70b9\\uff0c\\u5728ThinkCMF\\u4e2d\\u4f60\\u53ea\\u662f\\u589e\\u52a0\\u4e86\\u4e00\\u4e2aAPP\\uff0c\\u6bcf\\u4e2a\\u72ec\\u7acb\\u8fd0\\u884c\\u4e92\\u4e0d\\u5f71\\u54cd\\uff0c\\u4fbf\\u4e8e\\u7075\\u6d3b\\u6269\\u5c55\\u548c\\u4e8c\\u6b21\\u5f00\\u53d1\\u3002\"},{\"title\":\"\\u514d\\u8d39\\u5f00\\u6e90\",\"icon\":\"certificate\",\"content\":\"\\u4ee3\\u7801\\u9075\\u5faaApache2\\u5f00\\u6e90\\u534f\\u8bae\\uff0c\\u514d\\u8d39\\u4f7f\\u7528\\uff0c\\u5bf9\\u5546\\u4e1a\\u7528\\u6237\\u4e5f\\u65e0\\u4efb\\u4f55\\u9650\\u5236\\u3002\"}]}},\"home_last_news_202206300003\":{\"title\":\"\\u6700\\u65b0\\u8d44\\u8baf\",\"name\":\"last_news\",\"display\":\"1\",\"version\":\"1.0.0\",\"action\":\"\",\"vars\":{\"last_news_category_id\":\"\"}},\"home_last_news_202206300004\":{\"title\":\"\\u6700\\u65b0\\u8d44\\u8baf\",\"name\":\"last_news\",\"display\":\"1\",\"version\":\"1.0.0\",\"action\":\"\",\"vars\":{\"last_news_category_id\":\"\"}}}},\"footer\":{\"title\":\"\\u5e95\\u90e8\",\"widgets\":{\"home_footer_202206300003\":{\"title\":\"\\u5e95\\u90e8\",\"name\":\"footer\",\"display\":\"1\",\"public_widget_id\":\"footer\",\"version\":\"1.0.0\",\"action\":\"\",\"vars\":[]}}}}}' , `config_more` = '{\"widgets_blocks\":{\"top\":{\"title\":\"\\u9876\\u90e8\",\"widgets\":{\"top_nav_202206300003\":{\"title\":\"\\u9876\\u90e8\\u5bfc\\u822a\",\"name\":\"nav\",\"display\":\"1\",\"public_widget_id\":\"top_nav\"}}},\"body\":{\"title\":\"\\u4e3b\\u4f53\",\"widgets\":{\"home_slider_202206300003\":{\"title\":\"\\u9996\\u9875\\u5e7b\\u706f\\u7247\",\"name\":\"slider\",\"display\":\"1\"},\"home_features_202206300003\":{\"title\":\"\\u4ea7\\u54c1\\u7279\\u6027\",\"name\":\"features\",\"display\":\"1\"},\"home_last_news_202206300003\":{\"title\":\"\\u6700\\u65b0\\u8d44\\u8baf\",\"name\":\"last_news\",\"display\":\"1\"},\"home_last_news_202206300004\":{\"title\":\"\\u6700\\u65b0\\u8d44\\u8baf\",\"name\":\"last_news\",\"display\":\"1\"}}},\"footer\":{\"title\":\"\\u5e95\\u90e8\",\"widgets\":{\"home_footer_202206300003\":{\"title\":\"\\u5e95\\u90e8\",\"name\":\"footer\",\"display\":\"1\",\"public_widget_id\":\"footer\"}}}}}' , `description` = '首页模板文件' , `is_public` = 0 , `list_order` = '5' WHERE `theme` = 'default' AND `file` = 'portal/product' [ RunTime:0.005191s ]
- SELECT * FROM `cmf_theme_file` WHERE `theme` = 'default' AND `file` = 'portal/search' LIMIT 1 [ RunTime:0.000197s ]
- UPDATE `cmf_theme_file` SET `theme` = 'default' , `action` = 'portal/Index/index' , `file` = 'portal/search' , `name` = '首页' , `more` = '{\"widgets_blocks\":{\"top\":{\"title\":\"\\u9876\\u90e8\",\"widgets\":{\"top_nav_202206300003\":{\"title\":\"\\u9876\\u90e8\\u5bfc\\u822a\",\"name\":\"nav\",\"display\":\"1\",\"public_widget_id\":\"top_nav\",\"version\":\"1.0.0\",\"action\":\"\",\"vars\":{\"company_name\":\"ThinkCMF\",\"nav_id\":\"\"}}}},\"body\":{\"title\":\"\\u4e3b\\u4f53\",\"widgets\":{\"home_slider_202206300003\":{\"title\":\"\\u9996\\u9875\\u5e7b\\u706f\\u7247\",\"name\":\"slider\",\"display\":\"1\",\"version\":\"1.0.0\",\"action\":\"\",\"vars\":{\"slide_id\":\"\",\"fullscreen\":1}},\"home_features_202206300003\":{\"title\":\"\\u4ea7\\u54c1\\u7279\\u6027\",\"name\":\"features\",\"display\":\"1\",\"version\":\"1.0.0\",\"action\":\"\",\"vars\":{\"sub_title\":\"Quickly understand the ThinkCMF\",\"features\":[{\"title\":\"MVC\\u5206\\u5c42\\u6a21\\u5f0f\",\"icon\":\"bars\",\"content\":\"\\u4f7f\\u7528MVC\\u5e94\\u7528\\u7a0b\\u5e8f\\u88ab\\u5206\\u6210\\u4e09\\u4e2a\\u6838\\u5fc3\\u90e8\\u4ef6\\uff1a\\u6a21\\u578b\\uff08M\\uff09\\u3001\\u89c6\\u56fe\\uff08V\\uff09\\u3001\\u63a7\\u5236\\u5668\\uff08C\\uff09\\uff0c\\u4ed6\\u4e0d\\u662f\\u4e00\\u4e2a\\u65b0\\u7684\\u6982\\u5ff5\\uff0c\\u53ea\\u662fThinkCMF\\u5c06\\u5176\\u53d1\\u6325\\u5230\\u4e86\\u6781\\u81f4\\u3002\"},{\"title\":\"\\u7528\\u6237\\u7ba1\\u7406\",\"icon\":\"group\",\"content\":\"ThinkCMF\\u5185\\u7f6e\\u4e86\\u7075\\u6d3b\\u7684\\u7528\\u6237\\u7ba1\\u7406\\u65b9\\u5f0f\\uff0c\\u5e76\\u53ef\\u76f4\\u63a5\\u4e0e\\u7b2c\\u4e09\\u65b9\\u7ad9\\u70b9\\u8fdb\\u884c\\u4e92\\u8054\\u4e92\\u901a\\uff0c\\u5982\\u679c\\u4f60\\u613f\\u610f\\u751a\\u81f3\\u53ef\\u4ee5\\u5bf9\\u5355\\u4e2a\\u7528\\u6237\\u6216\\u7fa4\\u4f53\\u7528\\u6237\\u7684\\u884c\\u4e3a\\u8fdb\\u884c\\u8bb0\\u5f55\\u53ca\\u5206\\u4eab\\uff0c\\u4e3a\\u60a8\\u7684\\u8fd0\\u8425\\u51b3\\u7b56\\u63d0\\u4f9b\\u6709\\u6548\\u53c2\\u8003\\u6570\\u636e\\u3002\"},{\"title\":\"\\u4e91\\u7aef\\u90e8\\u7f72\",\"icon\":\"cloud\",\"content\":\"\\u901a\\u8fc7\\u9a71\\u52a8\\u7684\\u65b9\\u5f0f\\u53ef\\u4ee5\\u8f7b\\u677e\\u652f\\u6301\\u4e91\\u5e73\\u53f0\\u7684\\u90e8\\u7f72\\uff0c\\u8ba9\\u4f60\\u7684\\u7f51\\u7ad9\\u65e0\\u7f1d\\u8fc1\\u79fb\\uff0c\\u5185\\u7f6e\\u5df2\\u7ecf\\u652f\\u6301SAE\\u3001BAE\\uff0c\\u6b63\\u5f0f\\u7248\\u5c06\\u5bf9\\u4e91\\u7aef\\u90e8\\u7f72\\u8fdb\\u884c\\u8fdb\\u4e00\\u6b65\\u4f18\\u5316\\u3002\"},{\"title\":\"\\u5b89\\u5168\\u7b56\\u7565\",\"icon\":\"heart\",\"content\":\"\\u63d0\\u4f9b\\u7684\\u7a33\\u5065\\u7684\\u5b89\\u5168\\u7b56\\u7565\\uff0c\\u5305\\u62ec\\u5907\\u4efd\\u6062\\u590d\\uff0c\\u5bb9\\u9519\\uff0c\\u9632\\u6cbb\\u6076\\u610f\\u653b\\u51fb\\u767b\\u9646\\uff0c\\u7f51\\u9875\\u9632\\u7be1\\u6539\\u7b49\\u591a\\u9879\\u5b89\\u5168\\u7ba1\\u7406\\u529f\\u80fd\\uff0c\\u4fdd\\u8bc1\\u7cfb\\u7edf\\u5b89\\u5168\\uff0c\\u53ef\\u9760\\uff0c\\u7a33\\u5b9a\\u7684\\u8fd0\\u884c\\u3002\"},{\"title\":\"\\u5e94\\u7528\\u6a21\\u5757\\u5316\",\"icon\":\"cubes\",\"content\":\"\\u63d0\\u51fa\\u5168\\u65b0\\u7684\\u5e94\\u7528\\u6a21\\u5f0f\\u8fdb\\u884c\\u6269\\u5c55\\uff0c\\u4e0d\\u7ba1\\u662f\\u4f60\\u5f00\\u53d1\\u4e00\\u4e2a\\u5c0f\\u529f\\u80fd\\u8fd8\\u662f\\u4e00\\u4e2a\\u5168\\u65b0\\u7684\\u7ad9\\u70b9\\uff0c\\u5728ThinkCMF\\u4e2d\\u4f60\\u53ea\\u662f\\u589e\\u52a0\\u4e86\\u4e00\\u4e2aAPP\\uff0c\\u6bcf\\u4e2a\\u72ec\\u7acb\\u8fd0\\u884c\\u4e92\\u4e0d\\u5f71\\u54cd\\uff0c\\u4fbf\\u4e8e\\u7075\\u6d3b\\u6269\\u5c55\\u548c\\u4e8c\\u6b21\\u5f00\\u53d1\\u3002\"},{\"title\":\"\\u514d\\u8d39\\u5f00\\u6e90\",\"icon\":\"certificate\",\"content\":\"\\u4ee3\\u7801\\u9075\\u5faaApache2\\u5f00\\u6e90\\u534f\\u8bae\\uff0c\\u514d\\u8d39\\u4f7f\\u7528\\uff0c\\u5bf9\\u5546\\u4e1a\\u7528\\u6237\\u4e5f\\u65e0\\u4efb\\u4f55\\u9650\\u5236\\u3002\"}]}},\"home_last_news_202206300003\":{\"title\":\"\\u6700\\u65b0\\u8d44\\u8baf\",\"name\":\"last_news\",\"display\":\"1\",\"version\":\"1.0.0\",\"action\":\"\",\"vars\":{\"last_news_category_id\":\"\"}},\"home_last_news_202206300004\":{\"title\":\"\\u6700\\u65b0\\u8d44\\u8baf\",\"name\":\"last_news\",\"display\":\"1\",\"version\":\"1.0.0\",\"action\":\"\",\"vars\":{\"last_news_category_id\":\"\"}}}},\"footer\":{\"title\":\"\\u5e95\\u90e8\",\"widgets\":{\"home_footer_202206300003\":{\"title\":\"\\u5e95\\u90e8\",\"name\":\"footer\",\"display\":\"1\",\"public_widget_id\":\"footer\",\"version\":\"1.0.0\",\"action\":\"\",\"vars\":[]}}}}}' , `config_more` = '{\"widgets_blocks\":{\"top\":{\"title\":\"\\u9876\\u90e8\",\"widgets\":{\"top_nav_202206300003\":{\"title\":\"\\u9876\\u90e8\\u5bfc\\u822a\",\"name\":\"nav\",\"display\":\"1\",\"public_widget_id\":\"top_nav\"}}},\"body\":{\"title\":\"\\u4e3b\\u4f53\",\"widgets\":{\"home_slider_202206300003\":{\"title\":\"\\u9996\\u9875\\u5e7b\\u706f\\u7247\",\"name\":\"slider\",\"display\":\"1\"},\"home_features_202206300003\":{\"title\":\"\\u4ea7\\u54c1\\u7279\\u6027\",\"name\":\"features\",\"display\":\"1\"},\"home_last_news_202206300003\":{\"title\":\"\\u6700\\u65b0\\u8d44\\u8baf\",\"name\":\"last_news\",\"display\":\"1\"},\"home_last_news_202206300004\":{\"title\":\"\\u6700\\u65b0\\u8d44\\u8baf\",\"name\":\"last_news\",\"display\":\"1\"}}},\"footer\":{\"title\":\"\\u5e95\\u90e8\",\"widgets\":{\"home_footer_202206300003\":{\"title\":\"\\u5e95\\u90e8\",\"name\":\"footer\",\"display\":\"1\",\"public_widget_id\":\"footer\"}}}}}' , `description` = '首页模板文件' , `is_public` = 0 , `list_order` = '5' WHERE `theme` = 'default' AND `file` = 'portal/search' [ RunTime:0.008282s ]
- SELECT * FROM `cmf_theme_file` WHERE `theme` = 'default' AND `file` = 'portal/smart' LIMIT 1 [ RunTime:0.000201s ]
- UPDATE `cmf_theme_file` SET `theme` = 'default' , `action` = 'portal/Index/index' , `file` = 'portal/smart' , `name` = '首页' , `more` = '{\"widgets_blocks\":{\"top\":{\"title\":\"\\u9876\\u90e8\",\"widgets\":{\"top_nav_202206300003\":{\"title\":\"\\u9876\\u90e8\\u5bfc\\u822a\",\"name\":\"nav\",\"display\":\"1\",\"public_widget_id\":\"top_nav\",\"version\":\"1.0.0\",\"action\":\"\",\"vars\":{\"company_name\":\"ThinkCMF\",\"nav_id\":\"\"}}}},\"body\":{\"title\":\"\\u4e3b\\u4f53\",\"widgets\":{\"home_slider_202206300003\":{\"title\":\"name\",\"name\":\"slider\",\"display\":1,\"version\":\"1.0.0\",\"action\":\"\",\"vars\":{\"slide_id\":31,\"fullscreen\":1},\"css\":{\"margin-top\":0,\"margin-bottom\":0,\"margin-left\":0,\"margin-right\":0}}}},\"footer\":{\"title\":\"\\u5e95\\u90e8\",\"widgets\":{\"home_footer_202206300003\":{\"title\":\"\\u5e95\\u90e8\",\"name\":\"footer\",\"display\":\"1\",\"public_widget_id\":\"footer\",\"version\":\"1.0.0\",\"action\":\"\",\"vars\":{\"company_name\":\"ThinkCMF\",\"nav_id\":\"2\"}}}}}}' , `config_more` = '{\"widgets_blocks\":{\"top\":{\"title\":\"\\u9876\\u90e8\",\"widgets\":{\"top_nav_202206300003\":{\"title\":\"\\u9876\\u90e8\\u5bfc\\u822a\",\"name\":\"nav\",\"display\":\"1\",\"public_widget_id\":\"top_nav\"}}},\"body\":{\"title\":\"\\u4e3b\\u4f53\",\"widgets\":{\"home_slider_202206300003\":{\"title\":\"name\",\"name\":\"slider\",\"display\":1,\"version\":\"1.0.0\",\"action\":\"\",\"vars\":{\"slide_id\":31,\"fullscreen\":1},\"css\":{\"margin-top\":0,\"margin-bottom\":0,\"margin-left\":0,\"margin-right\":0}}}},\"footer\":{\"title\":\"\\u5e95\\u90e8\",\"widgets\":{\"home_footer_202206300003\":{\"title\":\"\\u5e95\\u90e8\",\"name\":\"footer\",\"display\":\"1\",\"public_widget_id\":\"footer\"}}}}}' , `description` = '首页模板文件' , `is_public` = 0 , `list_order` = '5' WHERE `theme` = 'default' AND `file` = 'portal/smart' [ RunTime:0.007697s ]
- SELECT * FROM `cmf_theme_file` WHERE `theme` = 'default' AND `file` = 'public/config' LIMIT 1 [ RunTime:0.000233s ]
- UPDATE `cmf_theme_file` SET `theme` = 'default' , `action` = 'public/Config' , `file` = 'public/config' , `name` = '模板全局配置' , `more` = '{\"vars\":{\"enable_mobile\":{\"title\":\"\\u624b\\u673a\\u6ce8\\u518c\",\"type\":\"select\",\"value\":1,\"options\":{\"1\":\"\\u5f00\\u542f\",\"0\":\"\\u5173\\u95ed\"},\"tip\":\"\"}},\"widgets_blocks\":{\"public\":{\"title\":\"\\u5168\\u5c40\",\"widgets\":{\"top_nav\":{\"title\":\"\\u9876\\u90e8\\u5bfc\\u822a\",\"name\":\"nav\",\"display\":1,\"version\":\"1.0.0\",\"action\":\"\",\"vars\":{\"company_name\":\"ThinkCMF\",\"nav_id\":\"1\"},\"css\":{\"margin-top\":\"0\",\"margin-bottom\":\"15px\",\"margin-left\":\"0\",\"margin-right\":\"0\"}},\"footer\":{\"title\":\"\\u5e95\\u90e8\",\"name\":\"footer\",\"display\":1,\"version\":\"1.0.0\",\"action\":\"\",\"vars\":[],\"css\":{\"margin-top\":\"0\",\"margin-bottom\":\"15px\",\"margin-left\":\"0\",\"margin-right\":\"0\"}}}}}}' , `config_more` = '{\"vars\":{\"enable_mobile\":{\"title\":\"\\u624b\\u673a\\u6ce8\\u518c\",\"type\":\"select\",\"value\":1,\"options\":{\"1\":\"\\u5f00\\u542f\",\"0\":\"\\u5173\\u95ed\"},\"tip\":\"\"}},\"widgets_blocks\":{\"public\":{\"title\":\"\\u5168\\u5c40\",\"widgets\":{\"top_nav\":{\"title\":\"\\u9876\\u90e8\\u5bfc\\u822a\",\"name\":\"nav\",\"display\":\"1\"},\"footer\":{\"title\":\"\\u5e95\\u90e8\",\"name\":\"footer\",\"display\":\"1\"}}}}}' , `description` = '模板全局配置文件' , `is_public` = 1 , `list_order` = '0' WHERE `theme` = 'default' AND `file` = 'public/config' [ RunTime:0.007783s ]
- SELECT * FROM `cmf_theme_file` WHERE `theme` = 'default' [ RunTime:0.000261s ]
- SHOW FULL COLUMNS FROM `cmf_theme` [ RunTime:0.000824s ]
- UPDATE `cmf_theme` SET `name` = 'default' , `version` = '8.0.0' , `demo_url` = 'http://demo.thinkcmf.com' , `author` = 'ThinkCMF' , `lang` = 'zh-cn' , `author_url` = 'http://www.thinkcmf.com' , `keywords` = 'ThinkCMF默认模板' , `description` = 'ThinkCMF默认模板' WHERE `theme` = 'default' [ RunTime:0.002963s ]
- SELECT `more`,`file`,`id`,`is_public` FROM `cmf_theme_file` WHERE `theme` = 'default' AND ( `is_public` = 1 OR `file` = 'portal/blog_detail' ) ORDER BY `is_public` DESC [ RunTime:0.000239s ]
- SHOW FULL COLUMNS FROM `cmf_nav_menu` [ RunTime:0.000845s ]
- SELECT * FROM `cmf_nav_menu` WHERE `nav_id` = 1 AND `status` = 1 ORDER BY `list_order` ASC [ RunTime:0.000485s ]
- SELECT * FROM `cmf_nav_menu` WHERE `nav_id` = 1 AND `status` = 1 ORDER BY `list_order` ASC [ RunTime:0.000493s ]
- SELECT * FROM `cmf_nav_menu` WHERE `nav_id` = 2 AND `status` = 1 ORDER BY `list_order` ASC [ RunTime:0.000379s ]
- SELECT * FROM `cmf_nav_menu` WHERE `nav_id` = 2 AND `status` = 1 ORDER BY `list_order` ASC [ RunTime:0.000304s ]

0.189528s

Introduction: The Silent Threat to Line-Rate Forwarding
In carrier-grade and enterprise core networks, a memory leak is not merely a software defect; it is a latent catalyst for packet forwarding degradation, control-plane instability, and ultimately, service outages. While modern telecom hardware is engineered for 99.999% availability and MTBF figures exceeding 300,000 hours, the gradual depletion of heap or pool memory within a routing engine can silently bypass traditional redundancy mechanisms. When a core switch or enterprise router begins to exhaust its memory resources due to an undetected leak, the symptoms often manifest first as increased latency, sporadic BGP flap cycles, or unexpected packet drops under sustained Mpps loads—long before an alarm is raised.
This manual provides a definitive, data-driven framework for leveraging the built-in performance monitor subsystems native to modern NOS platforms (such as Cisco IOS XR, NX-OS, and Juniper Junos) to inspect, baseline, and trend memory leak behaviors over time. Unlike generic OS-level monitoring, carrier Ethernet and datacenter switching platforms expose specialized counters that differentiate between page cache, kernel slab allocations, and user-space process heaps, enabling architects to isolate the leak source without disrupting IEEE 802.3 line-rate traffic.
Core Architecture: How Built-in Monitors Detect Leak Signatures
Process Memory Trending vs. Snapshot Diagnostics
A single
show memorysnapshot is insufficient for leak detection. The definitive indicator is a monotonic upward trend in memory consumption that does not correlate with traffic load or configuration events. Enterprise platforms utilize Periodic Accounting Managers (PAM) or equivalent daemons that sample process memory utilization at configurable intervals—typically 30 minutes—and apply proprietary algorithms to flag statistically significant increases . For instance, Cisco IOS XR generates a syslog warning when it detects a sustained memory increase for a specific process (e.g.,pam_memory_leaker), automatically collecting debug artifacts for root-cause analysis .Architects must distinguish between user-mode leaks (typically located in pageable pool) and kernel-mode leaks (depleting nonpaged pool). In Windows-based management planes, PerfMon counters such as
Pool Nonpaged BytesandPool Paged Bytesserve as the canonical indicators, but in telecom NOS environments, the equivalent is the process RSS (Resident Set Size) and kernel slab allocation counters accessible via diagnostic views .The Role of ASIC and Forwarding Plane Isolation
Modern core switches decouple the control plane from the forwarding plane. A memory leak in the routing protocol daemon (e.g., BGP, OSPF) does not immediately impact the ASIC-based packet pipeline; however, it will eventually trigger control-plane policing (CoPP) thresholds or cause the Rib to fail to update. Built-in monitors often expose separate counters for shared memory windows (e.g.,
fibv6,ipv4_fib) versus heap allocations. A leak in the FIB shared window is significantly more critical, as it directly threatens the line-rate forwarding capacity of the chassis .Technical Specifications: Monitoring Parameters and Thresholds
The following matrix delineates the critical parameters that a senior network architect must configure within the built-in performance monitor to establish a reliable leak-trending baseline. These thresholds are aligned with ITU-T Y.1564 performance assurance principles and MEF 3.0 service verification requirements.
It is imperative to note that memory alarms must be tiered. A Minor threshold (e.g., 88% utilization) triggers a syslog capture; a Severe threshold (e.g., 89%) initiates an automated memory snapshot dump; and a Critical threshold (e.g., 91%) may invoke protective measures such as process restart or traffic shaping to preserve node stability . On platforms supporting RoHS-compliant thermal management, excessive memory utilization can also correlate with elevated ASIC junction temperatures, as lookup table expansion consumes additional buffer resources.
Operational Workflow: Correlating Memory Trends with Network Events
Step 1: Establish a Clean Baseline
Before enabling granular leak detection, the performance monitor must capture a baseline during steady-state traffic—typically 24 to 72 hours after the last configuration change. Use CLI commands such as
show memory summary detail(Cisco IOS XR) orshow system internal memory-status(NX-OS) to record the allocated memory, free memory, and shared window metrics . The baseline must be exported to an external collector (e.g., Syslog, SNMP trap, or gRPC telemetry) for longitudinal analysis.Step 2: Enable Incremental Leak Detection
For Cisco IOS-based platforms, the
set memory debug incremental starting-timecommand establishes a temporal anchor. Subsequentshow memory debug incremental leaks summaryoutput isolates only those allocations that occurred after the anchor, filtering out legitimate runtime allocations . Critical Caveat: These debug commands invoke high CPU utilization and may cause time-sensitive protocols (e.g., BFD, LACP) to flap. They must be executed only within a maintenance window when the router is not operating under scaled conditions .Step 3: Trend Analysis and Root-Cause Isolation
When the performance monitor flags a monotonic increase in a specific process (e.g.,
netstackorbgp), cross-reference the timestamp with the Router Events graph or syslog. A memory spike coincident with a BGP update storm or an SNMP walk suggests a transient allocation issue; a steady linear increase independent of traffic indicates a true leak. On Huawei platforms, thepads diagnose memory leakcommand provides a Top 3 process memory consumption breakdown and a 7-sample historical trend at 24-hour intervals, enabling rapid triage .Deployment Scenarios: Mitigating Leak-Induced Outages in Production
In a high-density aggregation layer deployment—where a single chassis may terminate 48 × 100GE uplinks—a memory leak in the BGP route reflector process can degrade convergence time from sub-second to several minutes. By configuring the built-in monitor to trigger an EEM (Embedded Event Manager) applet when memory utilization exceeds the Severe threshold, operators can automatically execute
show process memory sortedand export the output to a pre-provisioned TFTP server before the condition escalates to a Critical state . This proactive data capture eliminates the diagnostic gap that often occurs when a device reloads unexpectedly.For carrier Ethernet environments governed by MEF CE 2.0 certification, the performance monitor must also correlate memory trends with EVC (Ethernet Virtual Connection) performance counters. A leak in the OAM subsystem, for example, may not immediately impact frame delay or frame loss ratio metrics, but it will eventually cause CFM session timeouts, triggering protection switching—a false positive that masks the underlying memory defect.
Conclusion: Institutionalizing Memory Hygiene as a Core NOC Discipline
Inspecting memory leak trends is not a one-time troubleshooting exercise; it is a continuous network hygiene discipline that separates reactive break-fix organizations from proactive, SLA-driven engineering teams. By leveraging the built-in performance monitor—whether through PerfMon counters in a management plane, PAM syslog alerts in IOS XR, or diagnostic CLI views in NX-OS and VRP—architects can transform raw memory utilization data into actionable intelligence. The objective is not merely to detect leaks, but to quantify their velocity (MB/hour), isolate their locus (process vs. kernel vs. shared window), and correlate their impact against the Gbps switching capacity and Mpps forwarding rate that define the network's service contract. In an era where MTBF is measured in decades, a memory leak left unchecked is an unacceptable operational risk.