 ZTE Router Hardware FAQ: Power Supply Failover, Fan Replacements & MTBF
27 Jul, 2026. Posted by:XPONSHOP
Most Views Posts
Inside the Hardware: RTC Power Domains, Battery Backup, and the 1970 Epoch Reset in Telecom Equipment
2026-10-26 12:27:47
Managing ONT Router: Initial Setup, Console Connection & Firmware Upgrades FAQ
2026-10-13 10:07:49
Nokia ISAM 7360 NG-PON2 Universal Line Card Wavelength Tuning Protocols - Official Technical Overview & Hardware Datasheet
2026-10-19 11:22:47
What are MTU and Jumbo Frame?
2025-12-03 16:01:42
Popular Posts
2-POTS ONU SIP Setup FAQ: Expert Answers to VoIP Configuration & Hardware Questions
2026-08-07 09:02:28
The Ultimate Guide to Sourcing High-Density PON Boards on the Secondary Market: Architecture, Backplane Bandwidth, and Deployment
2026-06-30 14:05:02
iMaster OmniSight-T License Troubleshooting— OSN1800 Lack of License
2025-10-22 09:03:57
GPON ONU on 10G EPON Network FAQ: Compatibility Answers for Network Architects
2026-09-29 09:22:52
ZTE OLT FAQ: Expert Answers to Technical & Deployment Questions
2026-05-06 17:05:40
Random Posts
Inside the Hardware: Power Modules, Fan Trays, and Silicon Efficiency of Customizing OEM ONTs
2026-07-03 10:52:19
GPON OLT FAQ: Expert Answers to Network Integration & Configuration Questions
2026-06-25 14:31:56
Engineering the Future of FTTH: A Deep Dive into the NOKIA NGLT-C 8-Port GPON Board for 7360 ISAM FX
2026-04-29 12:05:09
Recent Posts
AI Optical Transceivers vs. Telecom Optical Transceivers: Two ‘Personalities’ of the Same Component
2026-10-30 11:30:33
Overcoming Network Bottlenecks: Enterprise Configuration Manual for Nintendo Switch NAT Type D Resolution
2026-10-30 10:06:06
Cisco Business 350 Series Managed Switch Physical Security and Power Efficiency - Official Technical Overview & Hardware Datasheet
2026-10-30 10:03:46
About
XponShop blog describes some basics for Huawei / ZTE /
Nokia / FiberHome GPON OLT, ONT, SFP, and Site Power...
such as configurations, issue troubleshooting, knowledge
sharing, and keeps updating.
Recent posts
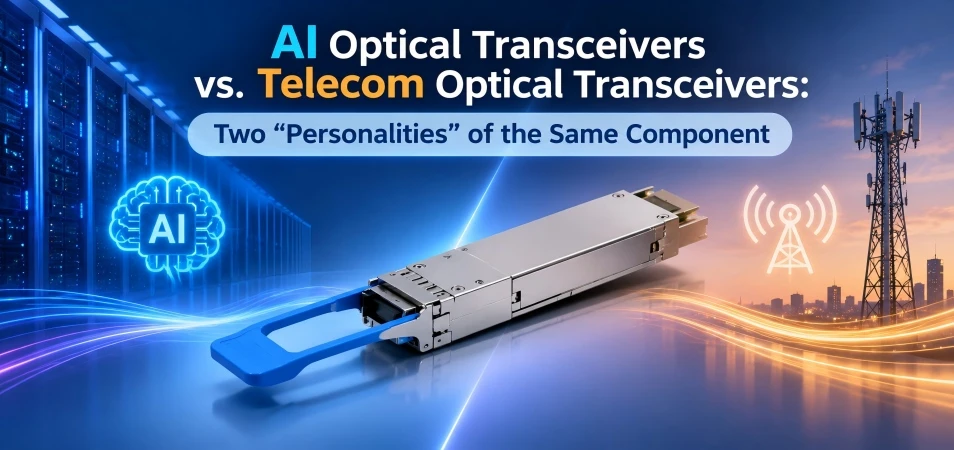 AI Optical Transceivers vs. Telecom Optical Transceivers: Two ‘Personalities’ of the Same Component
27 Mar, 2025
 Overcoming Network Bottlenecks: Enterprise Configuration Manual for Nintendo Switch NAT Type D Resolution
27 Mar, 2025
 Cisco Business 350 Series Managed Switch Physical Security and Power Efficiency - Official Technical Overview & Hardware Datasheet
27 Mar, 2025
AI Optical Transceivers vs. Telecom Optical Transceivers: Two ‘Personalities’ of the Same Component
27 Mar, 2025
Overcoming Network Bottlenecks: Enterprise Configuration Manual for Nintendo Switch NAT Type D Resolution
27 Mar, 2025
Cisco Business 350 Series Managed Switch Physical Security and Power Efficiency - Official Technical Overview & Hardware Datasheet
27 Mar, 2025
Products from the blog
基本
文件
流程
错误
SQL
调试
- 请求信息 : 2026-11-04 15:17:34 HTTP/2.0 GET : https://www.xponshop.com/blog/zte-router-hardware-faq-power-supply-failover-fan-replacements-amp-mtbf.html
- 运行时间 : 0.128327s [ 吞吐率:7.79req/s ] 内存消耗:1,490.74kb 文件加载:171
- 查询信息 : 0 queries
- 缓存信息 : 0 reads,0 writes
- 会话信息 : SESSION_ID=84b4c1249c4db79f2838fad5c565e22e
- /www/wwwroot/xpshop/public/index.php ( 2.34 KB )
- /www/wwwroot/xpshop/vendor/autoload.php ( 0.78 KB )
- /www/wwwroot/xpshop/vendor/composer/autoload_real.php ( 1.68 KB )
- /www/wwwroot/xpshop/vendor/composer/platform_check.php ( 1.04 KB )
- /www/wwwroot/xpshop/vendor/composer/ClassLoader.php ( 15.99 KB )
- /www/wwwroot/xpshop/vendor/composer/autoload_static.php ( 15.70 KB )
- /www/wwwroot/xpshop/vendor/topthink/think-helper/src/helper.php ( 8.64 KB )
- /www/wwwroot/xpshop/vendor/topthink/think-orm/stubs/load_stubs.php ( 0.17 KB )
- /www/wwwroot/xpshop/vendor/topthink/framework/src/think/Exception.php ( 1.75 KB )
- /www/wwwroot/xpshop/vendor/topthink/framework/src/think/Facade.php ( 2.81 KB )
- /www/wwwroot/xpshop/vendor/symfony/polyfill-mbstring/bootstrap.php ( 8.43 KB )
- /www/wwwroot/xpshop/vendor/symfony/polyfill-mbstring/bootstrap80.php ( 9.93 KB )
- /www/wwwroot/xpshop/vendor/symfony/deprecation-contracts/function.php ( 1.02 KB )
- /www/wwwroot/xpshop/vendor/ezyang/htmlpurifier/library/HTMLPurifier.composer.php ( 0.10 KB )
- /www/wwwroot/xpshop/vendor/hyperf/engine/src/Functions.php ( 0.87 KB )
- /www/wwwroot/xpshop/vendor/ralouphie/getallheaders/src/getallheaders.php ( 1.65 KB )
- /www/wwwroot/xpshop/vendor/symfony/polyfill-php80/bootstrap.php ( 1.54 KB )
- /www/wwwroot/xpshop/vendor/symfony/translation/Resources/functions.php ( 0.57 KB )
- /www/wwwroot/xpshop/vendor/thinkcmf/cmf/src/common.php ( 105.49 KB )
- /www/wwwroot/xpshop/vendor/yansongda/supports/src/Functions.php ( 1.59 KB )
- /www/wwwroot/xpshop/vendor/guzzlehttp/guzzle/src/functions_include.php ( 0.16 KB )
- /www/wwwroot/xpshop/vendor/guzzlehttp/guzzle/src/functions.php ( 5.72 KB )
- /www/wwwroot/xpshop/vendor/topthink/think-queue/src/common.php ( 1.04 KB )
- /www/wwwroot/xpshop/vendor/yansongda/pay/src/Functions.php ( 11.15 KB )
- /www/wwwroot/xpshop/vendor/thinkcmf/cmf/think/App.php ( 18.43 KB )
- /www/wwwroot/xpshop/vendor/topthink/framework/src/think/Container.php ( 15.93 KB )
- /www/wwwroot/xpshop/vendor/psr/container/src/ContainerInterface.php ( 1.06 KB )
- /www/wwwroot/xpshop/vendor/thinkcmf/cmf-app/src/provider.php ( 0.25 KB )
- /www/wwwroot/xpshop/vendor/thinkcmf/cmf/think/Http.php ( 7.47 KB )
- /www/wwwroot/xpshop/vendor/topthink/think-helper/src/helper/Str.php ( 7.51 KB )
- /www/wwwroot/xpshop/vendor/topthink/framework/src/think/Env.php ( 4.87 KB )
- /www/wwwroot/xpshop/app/common.php ( 3.15 KB )
- /www/wwwroot/xpshop/vendor/topthink/framework/src/helper.php ( 19.12 KB )
- /www/wwwroot/xpshop/vendor/topthink/framework/src/think/Config.php ( 4.79 KB )
- /www/wwwroot/xpshop/vendor/thinkcmf/cmf/src/config/app.php ( 1.39 KB )
- /www/wwwroot/xpshop/vendor/topthink/framework/src/think/facade/Env.php ( 1.71 KB )
- /www/wwwroot/xpshop/vendor/thinkcmf/cmf/src/config/cache.php ( 0.83 KB )
- /www/wwwroot/xpshop/vendor/thinkcmf/cmf/src/config/console.php ( 1.14 KB )
- /www/wwwroot/xpshop/vendor/thinkcmf/cmf/src/config/log.php ( 1.41 KB )
- /www/wwwroot/xpshop/vendor/thinkcmf/cmf/src/config/route.php ( 1.59 KB )
- /www/wwwroot/xpshop/vendor/thinkcmf/cmf/src/config/template.php ( 0.65 KB )
- /www/wwwroot/xpshop/vendor/thinkcmf/cmf/src/config/view.php ( 1.09 KB )
- /www/wwwroot/xpshop/config/app.php ( 0.09 KB )
- /www/wwwroot/xpshop/config/queue.php ( 1.33 KB )
- /www/wwwroot/xpshop/data/config/config.php ( 0.09 KB )
- /www/wwwroot/xpshop/data/config/database.php ( 2.40 KB )
- /www/wwwroot/xpshop/data/config/lang.php ( 0.46 KB )
- /www/wwwroot/xpshop/vendor/thinkcmf/cmf-app/src/event.php ( 0.58 KB )
- /www/wwwroot/xpshop/vendor/topthink/framework/src/think/Event.php ( 7.23 KB )
- /www/wwwroot/xpshop/app/event.php ( 0.25 KB )
- /www/wwwroot/xpshop/vendor/topthink/framework/src/think/Lang.php ( 7.49 KB )
- /www/wwwroot/xpshop/vendor/thinkcmf/cmf/src/listener/InitHookListener.php ( 2.59 KB )
- /www/wwwroot/xpshop/vendor/topthink/framework/src/think/facade/Route.php ( 4.76 KB )
- /www/wwwroot/xpshop/vendor/thinkcmf/cmf/think/Route.php ( 24.37 KB )
- /www/wwwroot/xpshop/vendor/topthink/framework/src/think/route/RuleName.php ( 5.55 KB )
- /www/wwwroot/xpshop/vendor/topthink/framework/src/think/route/Domain.php ( 5.71 KB )
- /www/wwwroot/xpshop/vendor/topthink/framework/src/think/route/RuleGroup.php ( 13.91 KB )
- /www/wwwroot/xpshop/vendor/thinkcmf/cmf/think/route/Rule.php ( 24.55 KB )
- /www/wwwroot/xpshop/vendor/topthink/framework/src/think/route/RuleItem.php ( 9.50 KB )
- /www/wwwroot/xpshop/vendor/topthink/framework/src/think/facade/Cache.php ( 2.11 KB )
- /www/wwwroot/xpshop/vendor/topthink/framework/src/think/Cache.php ( 5.11 KB )
- /www/wwwroot/xpshop/vendor/topthink/framework/src/think/Manager.php ( 4.09 KB )
- /www/wwwroot/xpshop/vendor/psr/simple-cache/src/CacheInterface.php ( 4.82 KB )
- /www/wwwroot/xpshop/vendor/topthink/think-helper/src/helper/Arr.php ( 16.72 KB )
- /www/wwwroot/xpshop/vendor/topthink/framework/src/think/cache/driver/File.php ( 7.89 KB )
- /www/wwwroot/xpshop/vendor/topthink/framework/src/think/cache/Driver.php ( 8.52 KB )
- /www/wwwroot/xpshop/vendor/topthink/framework/src/think/contract/CacheHandlerInterface.php ( 2.06 KB )
- /www/wwwroot/xpshop/vendor/topthink/framework/src/think/facade/Event.php ( 1.83 KB )
- /www/wwwroot/xpshop/app/listener/InitHookListener.php ( 0.82 KB )
- /www/wwwroot/xpshop/app/portal/route.php ( 7.83 KB )
- /www/wwwroot/xpshop/vendor/topthink/framework/src/think/Request.php ( 56.59 KB )
- /www/wwwroot/xpshop/vendor/topthink/think-orm/src/facade/Db.php ( 0.96 KB )
- /www/wwwroot/xpshop/vendor/topthink/framework/src/think/Db.php ( 2.99 KB )
- /www/wwwroot/xpshop/vendor/topthink/think-orm/src/DbManager.php ( 8.72 KB )
- /www/wwwroot/xpshop/vendor/topthink/framework/src/think/Log.php ( 6.51 KB )
- /www/wwwroot/xpshop/vendor/psr/log/src/LoggerTrait.php ( 2.79 KB )
- /www/wwwroot/xpshop/vendor/psr/log/src/LoggerInterface.php ( 2.80 KB )
- /www/wwwroot/xpshop/vendor/topthink/think-orm/src/db/connector/Mysql.php ( 4.50 KB )
- /www/wwwroot/xpshop/vendor/topthink/think-orm/src/db/PDOConnection.php ( 53.54 KB )
- /www/wwwroot/xpshop/vendor/topthink/think-orm/src/db/Connection.php ( 9.19 KB )
- /www/wwwroot/xpshop/vendor/topthink/think-orm/src/db/ConnectionInterface.php ( 5.08 KB )
- /www/wwwroot/xpshop/vendor/topthink/think-orm/src/db/builder/Mysql.php ( 17.07 KB )
- /www/wwwroot/xpshop/vendor/topthink/think-orm/src/db/Builder.php ( 23.03 KB )
- /www/wwwroot/xpshop/vendor/topthink/think-orm/src/db/BaseBuilder.php ( 28.23 KB )
- /www/wwwroot/xpshop/vendor/topthink/think-orm/src/db/Query.php ( 14.82 KB )
- /www/wwwroot/xpshop/vendor/topthink/think-orm/src/db/BaseQuery.php ( 42.79 KB )
- /www/wwwroot/xpshop/vendor/topthink/think-orm/src/db/concern/TimeFieldQuery.php ( 7.65 KB )
- /www/wwwroot/xpshop/vendor/topthink/think-orm/src/db/concern/AggregateQuery.php ( 3.39 KB )
- /www/wwwroot/xpshop/vendor/topthink/think-orm/src/db/concern/ModelRelationQuery.php ( 19.62 KB )
- /www/wwwroot/xpshop/vendor/topthink/think-orm/src/db/concern/ParamsBind.php ( 3.80 KB )
- /www/wwwroot/xpshop/vendor/topthink/think-orm/src/db/concern/ResultOperation.php ( 6.90 KB )
- /www/wwwroot/xpshop/vendor/topthink/think-orm/src/db/concern/Transaction.php ( 2.90 KB )
- /www/wwwroot/xpshop/vendor/topthink/think-orm/src/db/concern/WhereQuery.php ( 18.40 KB )
- /www/wwwroot/xpshop/vendor/topthink/think-orm/src/db/concern/JoinAndViewQuery.php ( 7.23 KB )
- /www/wwwroot/xpshop/vendor/topthink/think-orm/src/db/concern/TableFieldInfo.php ( 2.56 KB )
- /www/wwwroot/xpshop/vendor/topthink/framework/src/think/log/driver/File.php ( 6.38 KB )
- /www/wwwroot/xpshop/vendor/topthink/framework/src/think/contract/LogHandlerInterface.php ( 0.89 KB )
- /www/wwwroot/xpshop/vendor/topthink/framework/src/think/log/Channel.php ( 4.04 KB )
- /www/wwwroot/xpshop/vendor/topthink/framework/src/think/event/LogRecord.php ( 0.89 KB )
- /www/wwwroot/xpshop/vendor/topthink/framework/src/think/initializer/Error.php ( 3.38 KB )
- /www/wwwroot/xpshop/vendor/topthink/framework/src/think/initializer/RegisterService.php ( 1.37 KB )
- /www/wwwroot/xpshop/vendor/services.php ( 0.25 KB )
- /www/wwwroot/xpshop/vendor/topthink/framework/src/think/service/PaginatorService.php ( 1.57 KB )
- /www/wwwroot/xpshop/vendor/topthink/framework/src/think/Service.php ( 1.70 KB )
- /www/wwwroot/xpshop/vendor/topthink/framework/src/think/service/ValidateService.php ( 1.02 KB )
- /www/wwwroot/xpshop/vendor/topthink/framework/src/think/service/ModelService.php ( 1.80 KB )
- /www/wwwroot/xpshop/vendor/thinkcmf/cmf-appstore/src/AppStoreService.php ( 1.12 KB )
- /www/wwwroot/xpshop/vendor/topthink/think-queue/src/queue/Service.php ( 1.29 KB )
- /www/wwwroot/xpshop/vendor/topthink/think-trace/src/Service.php ( 0.79 KB )
- /www/wwwroot/xpshop/vendor/topthink/framework/src/think/Middleware.php ( 6.89 KB )
- /www/wwwroot/xpshop/vendor/xia/migration/src/Service.php ( 2.02 KB )
- /www/wwwroot/xpshop/vendor/topthink/framework/src/think/initializer/BootService.php ( 0.79 KB )
- /www/wwwroot/xpshop/vendor/topthink/think-orm/src/Paginator.php ( 12.21 KB )
- /www/wwwroot/xpshop/vendor/topthink/framework/src/think/Validate.php ( 48.38 KB )
- /www/wwwroot/xpshop/vendor/topthink/think-orm/src/Model.php ( 27.82 KB )
- /www/wwwroot/xpshop/vendor/topthink/think-orm/src/model/concern/Attribute.php ( 19.62 KB )
- /www/wwwroot/xpshop/vendor/topthink/think-orm/src/model/concern/RelationShip.php ( 27.32 KB )
- /www/wwwroot/xpshop/vendor/topthink/think-orm/src/model/concern/ModelEvent.php ( 2.33 KB )
- /www/wwwroot/xpshop/vendor/topthink/think-orm/src/model/concern/TimeStamp.php ( 5.92 KB )
- /www/wwwroot/xpshop/vendor/topthink/think-orm/src/model/concern/AutoWriteId.php ( 1.50 KB )
- /www/wwwroot/xpshop/vendor/topthink/think-orm/src/model/concern/Conversion.php ( 11.25 KB )
- /www/wwwroot/xpshop/vendor/topthink/think-helper/src/contract/Arrayable.php ( 0.10 KB )
- /www/wwwroot/xpshop/vendor/topthink/think-helper/src/contract/Jsonable.php ( 0.14 KB )
- /www/wwwroot/xpshop/vendor/thinkcmf/cmf/think/Console.php ( 23.46 KB )
- /www/wwwroot/xpshop/vendor/thinkcmf/cmf-app/src/middleware.php ( 0.26 KB )
- /www/wwwroot/xpshop/vendor/topthink/framework/src/think/Pipeline.php ( 2.71 KB )
- /www/wwwroot/xpshop/vendor/topthink/think-trace/src/TraceDebug.php ( 3.05 KB )
- /www/wwwroot/xpshop/vendor/thinkcmf/cmf/src/middleware/LangDetect.php ( 5.94 KB )
- /www/wwwroot/xpshop/vendor/topthink/framework/src/think/Cookie.php ( 6.19 KB )
- /www/wwwroot/xpshop/vendor/topthink/framework/src/think/middleware/SessionInit.php ( 2.01 KB )
- /www/wwwroot/xpshop/vendor/topthink/framework/src/think/Session.php ( 1.86 KB )
- /www/wwwroot/xpshop/vendor/topthink/framework/src/think/session/driver/File.php ( 6.52 KB )
- /www/wwwroot/xpshop/vendor/topthink/framework/src/think/contract/SessionHandlerInterface.php ( 0.89 KB )
- /www/wwwroot/xpshop/vendor/topthink/framework/src/think/session/Store.php ( 7.37 KB )
- /www/wwwroot/xpshop/data/route/route.php ( 10.75 KB )
- /www/wwwroot/xpshop/vendor/thinkcmf/cmf/think/route/dispatch/Controller.php ( 7.73 KB )
- /www/wwwroot/xpshop/vendor/topthink/framework/src/think/route/Dispatch.php ( 6.29 KB )
- /www/wwwroot/xpshop/vendor/thinkcmf/cmf/src/listener/ModuleInitListener.php ( 2.20 KB )
- /www/wwwroot/xpshop/vendor/topthink/think-helper/src/Collection.php ( 17.14 KB )
- /www/wwwroot/xpshop/app/portal/controller/BlogController.php ( 5.17 KB )
- /www/wwwroot/xpshop/vendor/thinkcmf/cmf/src/controller/HomeBaseController.php ( 13.79 KB )
- /www/wwwroot/xpshop/vendor/thinkcmf/cmf/src/controller/BaseController.php ( 10.69 KB )
- /www/wwwroot/xpshop/vendor/thinkcmf/cmf/think/View.php ( 5.21 KB )
- /www/wwwroot/xpshop/vendor/topthink/framework/src/think/facade/Config.php ( 1.41 KB )
- /www/wwwroot/xpshop/vendor/topthink/framework/src/think/facade/Cookie.php ( 1.52 KB )
- /www/wwwroot/xpshop/vendor/thinkcmf/cmf/think/view/driver/Think.php ( 8.67 KB )
- /www/wwwroot/xpshop/vendor/thinkcmf/cmf/think/Template.php ( 55.14 KB )
- /www/wwwroot/xpshop/vendor/thinkcmf/cmf/think/template/driver/File.php ( 2.42 KB )
- /www/wwwroot/xpshop/vendor/thinkcmf/cmf-app/src/admin/model/LinkModel.php ( 0.92 KB )
- /www/wwwroot/xpshop/vendor/topthink/think-orm/src/model/Collection.php ( 6.93 KB )
- /www/wwwroot/xpshop/api/portal/model/SocialModel.php ( 2.51 KB )
- /www/wwwroot/xpshop/vendor/thinkcmf/cmf/src/listener/HomeLangListener.php ( 3.40 KB )
- /www/wwwroot/xpshop/vendor/topthink/framework/src/think/facade/Session.php ( 1.84 KB )
- /www/wwwroot/xpshop/app/listener/HomeInitListener.php ( 3.09 KB )
- /www/wwwroot/xpshop/api/portal/model/NewsModel.php ( 1.73 KB )
- /www/wwwroot/xpshop/vendor/thinkcmf/cmf/src/lib/Storage.php ( 4.40 KB )
- /www/wwwroot/xpshop/vendor/thinkcmf/cmf/src/lib/storage/Local.php ( 2.97 KB )
- /www/wwwroot/xpshop/api/portal/model/PortalPostModel.php ( 26.71 KB )
- /www/wwwroot/xpshop/vendor/topthink/think-orm/src/db/Raw.php ( 1.28 KB )
- /www/wwwroot/xpshop/vendor/thinkcmf/cmf-app/src/admin/model/ThemeModel.php ( 12.56 KB )
- /www/wwwroot/xpshop/vendor/thinkcmf/cmf-app/src/admin/model/ThemeFileModel.php ( 1.96 KB )
- /www/wwwroot/xpshop/data/runtime/temp/english_6df7f0f34cddea77df5aa1fa9591dd7b.php ( 62.29 KB )
- /www/wwwroot/xpshop/vendor/thinkcmf/cmf-app/src/admin/model/NavMenuModel.php ( 9.60 KB )
- /www/wwwroot/xpshop/vendor/thinkcmf/cmf-extend/src/tree/Tree.php ( 10.30 KB )
- /www/wwwroot/xpshop/vendor/thinkcmf/cmf-app/src/admin/model/RouteModel.php ( 8.92 KB )
- /www/wwwroot/xpshop/app/portal/url.php ( 1.60 KB )
- /www/wwwroot/xpshop/vendor/thinkcmf/cmf-app/src/user/url.php ( 1.01 KB )
- /www/wwwroot/xpshop/vendor/thinkcmf/cmf/think/route/Url.php ( 17.14 KB )
- /www/wwwroot/xpshop/vendor/topthink/framework/src/think/Response.php ( 9.05 KB )
- /www/wwwroot/xpshop/vendor/topthink/framework/src/think/response/Html.php ( 1.01 KB )
- /www/wwwroot/xpshop/vendor/topthink/think-trace/src/Html.php ( 4.49 KB )
- CONNECT:[ UseTime:0.000275s ] mysql:host=127.0.0.1;port=3306;dbname=xpshop;charset=utf8mb4
- SHOW FULL COLUMNS FROM `cmf_news` [ RunTime:0.000974s ]
- SELECT * FROM `cmf_news` WHERE `news_status` = 1 AND `slug` = 'zte-router-hardware-faq-power-supply-failover-fan-replacements-amp-mtbf' LIMIT 1 [ RunTime:0.002160s ]
- SHOW FULL COLUMNS FROM `cmf_link` [ RunTime:0.000834s ]
- SELECT * FROM `cmf_link` WHERE `status` = 1 [ RunTime:0.000203s ]
- SHOW FULL COLUMNS FROM `cmf_social` [ RunTime:0.000734s ]
- SELECT * FROM `cmf_social` WHERE `status` = 1 [ RunTime:0.000175s ]
- SHOW FULL COLUMNS FROM `cmf_portal_category` [ RunTime:0.000805s ]
- SELECT * FROM `cmf_portal_category` WHERE `module_id` = 2 ORDER BY `list_order` ASC [ RunTime:0.000364s ]
- SHOW FULL COLUMNS FROM `cmf_countries` [ RunTime:0.000805s ]
- SELECT * FROM `cmf_countries` [ RunTime:0.000234s ]
- SELECT * FROM `cmf_news` WHERE `slug` = 'zte-router-hardware-faq-power-supply-failover-fan-replacements-amp-mtbf' LIMIT 1 [ RunTime:0.001880s ]
- SHOW FULL COLUMNS FROM `cmf_option` [ RunTime:0.000893s ]
- SELECT `option_value` FROM `cmf_option` WHERE `option_name` = 'storage' LIMIT 1 [ RunTime:0.000144s ]
- SELECT * FROM `cmf_news` WHERE `news_status` = 1 ORDER BY `create_time` DESC LIMIT 3 [ RunTime:0.003134s ]
- SHOW FULL COLUMNS FROM `cmf_portal_post` [ RunTime:0.001196s ]
- SELECT * FROM `cmf_portal_post` WHERE 0 = 1 AND `post_type` = 1 [ RunTime:0.000195s ]
- SHOW FULL COLUMNS FROM `cmf_news_comment` [ RunTime:0.000685s ]
- SELECT * FROM `cmf_news_comment` WHERE `news_id` = 648 AND `status` = 1 ORDER BY `create_time` ASC [ RunTime:0.000159s ]
- SELECT * FROM `cmf_news` ORDER BY RAND() LIMIT 5 [ RunTime:0.006825s ]
- SELECT * FROM `cmf_news` ORDER BY RAND() LIMIT 5 [ RunTime:0.007206s ]
- SELECT * FROM `cmf_news` ORDER BY RAND() LIMIT 5 [ RunTime:0.007018s ]
- SELECT * FROM `cmf_news` ORDER BY `create_time` DESC LIMIT 5 [ RunTime:0.004062s ]
- SHOW FULL COLUMNS FROM `cmf_theme_file` [ RunTime:0.000856s ]
- SELECT * FROM `cmf_theme_file` WHERE `theme` = 'default' AND `file` = 'portal/404' LIMIT 1 [ RunTime:0.000206s ]
- UPDATE `cmf_theme_file` SET `theme` = 'default' , `action` = 'portal/Index/Notfound' , `file` = 'portal/404' , `name` = '首页' , `more` = '{\"widgets_blocks\":{\"top\":{\"title\":\"\\u9876\\u90e8\",\"widgets\":{\"top_nav_202206300003\":{\"title\":\"\\u9876\\u90e8\\u5bfc\\u822a\",\"name\":\"nav\",\"display\":\"1\",\"public_widget_id\":\"top_nav\",\"version\":\"1.0.0\",\"action\":\"\",\"vars\":{\"company_name\":\"ThinkCMF\",\"nav_id\":\"\"}}}},\"body\":{\"title\":\"\\u4e3b\\u4f53\",\"widgets\":{\"home_slider_202206300003\":{\"title\":\"\\u9996\\u9875\\u5e7b\\u706f\\u7247\",\"name\":\"slider\",\"display\":\"1\",\"version\":\"1.0.0\",\"action\":\"\",\"vars\":{\"slide_id\":\"\",\"fullscreen\":1}},\"home_features_202206300003\":{\"title\":\"\\u4ea7\\u54c1\\u7279\\u6027\",\"name\":\"features\",\"display\":\"1\",\"version\":\"1.0.0\",\"action\":\"\",\"vars\":{\"sub_title\":\"Quickly understand the ThinkCMF\",\"features\":[{\"title\":\"MVC\\u5206\\u5c42\\u6a21\\u5f0f\",\"icon\":\"bars\",\"content\":\"\\u4f7f\\u7528MVC\\u5e94\\u7528\\u7a0b\\u5e8f\\u88ab\\u5206\\u6210\\u4e09\\u4e2a\\u6838\\u5fc3\\u90e8\\u4ef6\\uff1a\\u6a21\\u578b\\uff08M\\uff09\\u3001\\u89c6\\u56fe\\uff08V\\uff09\\u3001\\u63a7\\u5236\\u5668\\uff08C\\uff09\\uff0c\\u4ed6\\u4e0d\\u662f\\u4e00\\u4e2a\\u65b0\\u7684\\u6982\\u5ff5\\uff0c\\u53ea\\u662fThinkCMF\\u5c06\\u5176\\u53d1\\u6325\\u5230\\u4e86\\u6781\\u81f4\\u3002\"},{\"title\":\"\\u7528\\u6237\\u7ba1\\u7406\",\"icon\":\"group\",\"content\":\"ThinkCMF\\u5185\\u7f6e\\u4e86\\u7075\\u6d3b\\u7684\\u7528\\u6237\\u7ba1\\u7406\\u65b9\\u5f0f\\uff0c\\u5e76\\u53ef\\u76f4\\u63a5\\u4e0e\\u7b2c\\u4e09\\u65b9\\u7ad9\\u70b9\\u8fdb\\u884c\\u4e92\\u8054\\u4e92\\u901a\\uff0c\\u5982\\u679c\\u4f60\\u613f\\u610f\\u751a\\u81f3\\u53ef\\u4ee5\\u5bf9\\u5355\\u4e2a\\u7528\\u6237\\u6216\\u7fa4\\u4f53\\u7528\\u6237\\u7684\\u884c\\u4e3a\\u8fdb\\u884c\\u8bb0\\u5f55\\u53ca\\u5206\\u4eab\\uff0c\\u4e3a\\u60a8\\u7684\\u8fd0\\u8425\\u51b3\\u7b56\\u63d0\\u4f9b\\u6709\\u6548\\u53c2\\u8003\\u6570\\u636e\\u3002\"},{\"title\":\"\\u4e91\\u7aef\\u90e8\\u7f72\",\"icon\":\"cloud\",\"content\":\"\\u901a\\u8fc7\\u9a71\\u52a8\\u7684\\u65b9\\u5f0f\\u53ef\\u4ee5\\u8f7b\\u677e\\u652f\\u6301\\u4e91\\u5e73\\u53f0\\u7684\\u90e8\\u7f72\\uff0c\\u8ba9\\u4f60\\u7684\\u7f51\\u7ad9\\u65e0\\u7f1d\\u8fc1\\u79fb\\uff0c\\u5185\\u7f6e\\u5df2\\u7ecf\\u652f\\u6301SAE\\u3001BAE\\uff0c\\u6b63\\u5f0f\\u7248\\u5c06\\u5bf9\\u4e91\\u7aef\\u90e8\\u7f72\\u8fdb\\u884c\\u8fdb\\u4e00\\u6b65\\u4f18\\u5316\\u3002\"},{\"title\":\"\\u5b89\\u5168\\u7b56\\u7565\",\"icon\":\"heart\",\"content\":\"\\u63d0\\u4f9b\\u7684\\u7a33\\u5065\\u7684\\u5b89\\u5168\\u7b56\\u7565\\uff0c\\u5305\\u62ec\\u5907\\u4efd\\u6062\\u590d\\uff0c\\u5bb9\\u9519\\uff0c\\u9632\\u6cbb\\u6076\\u610f\\u653b\\u51fb\\u767b\\u9646\\uff0c\\u7f51\\u9875\\u9632\\u7be1\\u6539\\u7b49\\u591a\\u9879\\u5b89\\u5168\\u7ba1\\u7406\\u529f\\u80fd\\uff0c\\u4fdd\\u8bc1\\u7cfb\\u7edf\\u5b89\\u5168\\uff0c\\u53ef\\u9760\\uff0c\\u7a33\\u5b9a\\u7684\\u8fd0\\u884c\\u3002\"},{\"title\":\"\\u5e94\\u7528\\u6a21\\u5757\\u5316\",\"icon\":\"cubes\",\"content\":\"\\u63d0\\u51fa\\u5168\\u65b0\\u7684\\u5e94\\u7528\\u6a21\\u5f0f\\u8fdb\\u884c\\u6269\\u5c55\\uff0c\\u4e0d\\u7ba1\\u662f\\u4f60\\u5f00\\u53d1\\u4e00\\u4e2a\\u5c0f\\u529f\\u80fd\\u8fd8\\u662f\\u4e00\\u4e2a\\u5168\\u65b0\\u7684\\u7ad9\\u70b9\\uff0c\\u5728ThinkCMF\\u4e2d\\u4f60\\u53ea\\u662f\\u589e\\u52a0\\u4e86\\u4e00\\u4e2aAPP\\uff0c\\u6bcf\\u4e2a\\u72ec\\u7acb\\u8fd0\\u884c\\u4e92\\u4e0d\\u5f71\\u54cd\\uff0c\\u4fbf\\u4e8e\\u7075\\u6d3b\\u6269\\u5c55\\u548c\\u4e8c\\u6b21\\u5f00\\u53d1\\u3002\"},{\"title\":\"\\u514d\\u8d39\\u5f00\\u6e90\",\"icon\":\"certificate\",\"content\":\"\\u4ee3\\u7801\\u9075\\u5faaApache2\\u5f00\\u6e90\\u534f\\u8bae\\uff0c\\u514d\\u8d39\\u4f7f\\u7528\\uff0c\\u5bf9\\u5546\\u4e1a\\u7528\\u6237\\u4e5f\\u65e0\\u4efb\\u4f55\\u9650\\u5236\\u3002\"}]}},\"home_last_news_202206300003\":{\"title\":\"\\u6700\\u65b0\\u8d44\\u8baf\",\"name\":\"last_news\",\"display\":\"1\",\"version\":\"1.0.0\",\"action\":\"\",\"vars\":{\"last_news_category_id\":\"\"}},\"home_last_news_202206300004\":{\"title\":\"\\u6700\\u65b0\\u8d44\\u8baf\",\"name\":\"last_news\",\"display\":\"1\",\"version\":\"1.0.0\",\"action\":\"\",\"vars\":{\"last_news_category_id\":\"\"}}}},\"footer\":{\"title\":\"\\u5e95\\u90e8\",\"widgets\":{\"home_footer_202206300003\":{\"title\":\"\\u5e95\\u90e8\",\"name\":\"footer\",\"display\":\"1\",\"public_widget_id\":\"footer\",\"version\":\"1.0.0\",\"action\":\"\",\"vars\":{\"company_name\":\"ThinkCMF\",\"nav_id\":\"2\"}}}}}}' , `config_more` = '{\"widgets_blocks\":{\"top\":{\"title\":\"\\u9876\\u90e8\",\"widgets\":{\"top_nav_202206300003\":{\"title\":\"\\u9876\\u90e8\\u5bfc\\u822a\",\"name\":\"nav\",\"display\":\"1\",\"public_widget_id\":\"top_nav\"}}},\"body\":{\"title\":\"\\u4e3b\\u4f53\",\"widgets\":{\"home_slider_202206300003\":{\"title\":\"\\u9996\\u9875\\u5e7b\\u706f\\u7247\",\"name\":\"slider\",\"display\":\"1\"},\"home_features_202206300003\":{\"title\":\"\\u4ea7\\u54c1\\u7279\\u6027\",\"name\":\"features\",\"display\":\"1\"},\"home_last_news_202206300003\":{\"title\":\"\\u6700\\u65b0\\u8d44\\u8baf\",\"name\":\"last_news\",\"display\":\"1\"},\"home_last_news_202206300004\":{\"title\":\"\\u6700\\u65b0\\u8d44\\u8baf\",\"name\":\"last_news\",\"display\":\"1\"}}},\"footer\":{\"title\":\"\\u5e95\\u90e8\",\"widgets\":{\"home_footer_202206300003\":{\"title\":\"\\u5e95\\u90e8\",\"name\":\"footer\",\"display\":\"1\",\"public_widget_id\":\"footer\"}}}}}' , `description` = '首页模板文件' , `is_public` = 0 , `list_order` = '5' WHERE `theme` = 'default' AND `file` = 'portal/404' [ RunTime:0.003036s ]
- SELECT * FROM `cmf_theme_file` WHERE `theme` = 'default' AND `file` = 'portal/about' LIMIT 1 [ RunTime:0.000182s ]
- UPDATE `cmf_theme_file` SET `theme` = 'default' , `action` = 'portal/Index/index' , `file` = 'portal/about' , `name` = '首页' , `more` = '{\"widgets_blocks\":{\"top\":{\"title\":\"\\u9876\\u90e8\",\"widgets\":{\"top_nav_202206300003\":{\"title\":\"\\u9876\\u90e8\\u5bfc\\u822a\",\"name\":\"nav\",\"display\":\"1\",\"public_widget_id\":\"top_nav\",\"version\":\"1.0.0\",\"action\":\"\",\"vars\":{\"company_name\":\"ThinkCMF\",\"nav_id\":\"\"}}}},\"body\":{\"title\":\"\\u4e3b\\u4f53\",\"widgets\":{\"home_slider_202206300003\":{\"title\":\"home\",\"name\":\"slider\",\"display\":\"1\",\"vars\":{\"slide_id\":\"23\",\"fullscreen\":1}},\"home_features_202206300003\":{\"title\":\"\\u4ea7\\u54c1\\u7279\\u6027\",\"name\":\"features\",\"display\":\"1\",\"version\":\"1.0.0\",\"action\":\"\",\"vars\":{\"sub_title\":\"Quickly understand the ThinkCMF\",\"features\":[{\"title\":\"MVC\\u5206\\u5c42\\u6a21\\u5f0f\",\"icon\":\"bars\",\"content\":\"\\u4f7f\\u7528MVC\\u5e94\\u7528\\u7a0b\\u5e8f\\u88ab\\u5206\\u6210\\u4e09\\u4e2a\\u6838\\u5fc3\\u90e8\\u4ef6\\uff1a\\u6a21\\u578b\\uff08M\\uff09\\u3001\\u89c6\\u56fe\\uff08V\\uff09\\u3001\\u63a7\\u5236\\u5668\\uff08C\\uff09\\uff0c\\u4ed6\\u4e0d\\u662f\\u4e00\\u4e2a\\u65b0\\u7684\\u6982\\u5ff5\\uff0c\\u53ea\\u662fThinkCMF\\u5c06\\u5176\\u53d1\\u6325\\u5230\\u4e86\\u6781\\u81f4\\u3002\"},{\"title\":\"\\u7528\\u6237\\u7ba1\\u7406\",\"icon\":\"group\",\"content\":\"ThinkCMF\\u5185\\u7f6e\\u4e86\\u7075\\u6d3b\\u7684\\u7528\\u6237\\u7ba1\\u7406\\u65b9\\u5f0f\\uff0c\\u5e76\\u53ef\\u76f4\\u63a5\\u4e0e\\u7b2c\\u4e09\\u65b9\\u7ad9\\u70b9\\u8fdb\\u884c\\u4e92\\u8054\\u4e92\\u901a\\uff0c\\u5982\\u679c\\u4f60\\u613f\\u610f\\u751a\\u81f3\\u53ef\\u4ee5\\u5bf9\\u5355\\u4e2a\\u7528\\u6237\\u6216\\u7fa4\\u4f53\\u7528\\u6237\\u7684\\u884c\\u4e3a\\u8fdb\\u884c\\u8bb0\\u5f55\\u53ca\\u5206\\u4eab\\uff0c\\u4e3a\\u60a8\\u7684\\u8fd0\\u8425\\u51b3\\u7b56\\u63d0\\u4f9b\\u6709\\u6548\\u53c2\\u8003\\u6570\\u636e\\u3002\"},{\"title\":\"\\u4e91\\u7aef\\u90e8\\u7f72\",\"icon\":\"cloud\",\"content\":\"\\u901a\\u8fc7\\u9a71\\u52a8\\u7684\\u65b9\\u5f0f\\u53ef\\u4ee5\\u8f7b\\u677e\\u652f\\u6301\\u4e91\\u5e73\\u53f0\\u7684\\u90e8\\u7f72\\uff0c\\u8ba9\\u4f60\\u7684\\u7f51\\u7ad9\\u65e0\\u7f1d\\u8fc1\\u79fb\\uff0c\\u5185\\u7f6e\\u5df2\\u7ecf\\u652f\\u6301SAE\\u3001BAE\\uff0c\\u6b63\\u5f0f\\u7248\\u5c06\\u5bf9\\u4e91\\u7aef\\u90e8\\u7f72\\u8fdb\\u884c\\u8fdb\\u4e00\\u6b65\\u4f18\\u5316\\u3002\"},{\"title\":\"\\u5b89\\u5168\\u7b56\\u7565\",\"icon\":\"heart\",\"content\":\"\\u63d0\\u4f9b\\u7684\\u7a33\\u5065\\u7684\\u5b89\\u5168\\u7b56\\u7565\\uff0c\\u5305\\u62ec\\u5907\\u4efd\\u6062\\u590d\\uff0c\\u5bb9\\u9519\\uff0c\\u9632\\u6cbb\\u6076\\u610f\\u653b\\u51fb\\u767b\\u9646\\uff0c\\u7f51\\u9875\\u9632\\u7be1\\u6539\\u7b49\\u591a\\u9879\\u5b89\\u5168\\u7ba1\\u7406\\u529f\\u80fd\\uff0c\\u4fdd\\u8bc1\\u7cfb\\u7edf\\u5b89\\u5168\\uff0c\\u53ef\\u9760\\uff0c\\u7a33\\u5b9a\\u7684\\u8fd0\\u884c\\u3002\"},{\"title\":\"\\u5e94\\u7528\\u6a21\\u5757\\u5316\",\"icon\":\"cubes\",\"content\":\"\\u63d0\\u51fa\\u5168\\u65b0\\u7684\\u5e94\\u7528\\u6a21\\u5f0f\\u8fdb\\u884c\\u6269\\u5c55\\uff0c\\u4e0d\\u7ba1\\u662f\\u4f60\\u5f00\\u53d1\\u4e00\\u4e2a\\u5c0f\\u529f\\u80fd\\u8fd8\\u662f\\u4e00\\u4e2a\\u5168\\u65b0\\u7684\\u7ad9\\u70b9\\uff0c\\u5728ThinkCMF\\u4e2d\\u4f60\\u53ea\\u662f\\u589e\\u52a0\\u4e86\\u4e00\\u4e2aAPP\\uff0c\\u6bcf\\u4e2a\\u72ec\\u7acb\\u8fd0\\u884c\\u4e92\\u4e0d\\u5f71\\u54cd\\uff0c\\u4fbf\\u4e8e\\u7075\\u6d3b\\u6269\\u5c55\\u548c\\u4e8c\\u6b21\\u5f00\\u53d1\\u3002\"},{\"title\":\"\\u514d\\u8d39\\u5f00\\u6e90\",\"icon\":\"certificate\",\"content\":\"\\u4ee3\\u7801\\u9075\\u5faaApache2\\u5f00\\u6e90\\u534f\\u8bae\\uff0c\\u514d\\u8d39\\u4f7f\\u7528\\uff0c\\u5bf9\\u5546\\u4e1a\\u7528\\u6237\\u4e5f\\u65e0\\u4efb\\u4f55\\u9650\\u5236\\u3002\"}]}},\"home_last_news_202206300003\":{\"title\":\"\\u6700\\u65b0\\u8d44\\u8baf\",\"name\":\"last_news\",\"display\":\"1\",\"version\":\"1.0.0\",\"action\":\"\",\"vars\":{\"last_news_category_id\":\"\"}},\"home_last_news_202206300004\":{\"title\":\"\\u6700\\u65b0\\u8d44\\u8baf\",\"name\":\"last_news\",\"display\":\"1\",\"version\":\"1.0.0\",\"action\":\"\",\"vars\":{\"last_news_category_id\":\"\"}}}},\"footer\":{\"title\":\"\\u5e95\\u90e8\",\"widgets\":{\"home_footer_202206300003\":{\"title\":\"\\u5e95\\u90e8\",\"name\":\"footer\",\"display\":\"1\",\"public_widget_id\":\"footer\",\"version\":\"1.0.0\",\"action\":\"\",\"vars\":[]}}}}}' , `config_more` = '{\"widgets_blocks\":{\"top\":{\"title\":\"\\u9876\\u90e8\",\"widgets\":{\"top_nav_202206300003\":{\"title\":\"\\u9876\\u90e8\\u5bfc\\u822a\",\"name\":\"nav\",\"display\":\"1\",\"public_widget_id\":\"top_nav\"}}},\"body\":{\"title\":\"\\u4e3b\\u4f53\",\"widgets\":{\"home_slider_202206300003\":{\"title\":\"\\u9996\\u9875\\u5e7b\\u706f\\u7247\",\"name\":\"slider\",\"display\":\"1\"},\"home_features_202206300003\":{\"title\":\"\\u4ea7\\u54c1\\u7279\\u6027\",\"name\":\"features\",\"display\":\"1\"},\"home_last_news_202206300003\":{\"title\":\"\\u6700\\u65b0\\u8d44\\u8baf\",\"name\":\"last_news\",\"display\":\"1\"},\"home_last_news_202206300004\":{\"title\":\"\\u6700\\u65b0\\u8d44\\u8baf\",\"name\":\"last_news\",\"display\":\"1\"}}},\"footer\":{\"title\":\"\\u5e95\\u90e8\",\"widgets\":{\"home_footer_202206300003\":{\"title\":\"\\u5e95\\u90e8\",\"name\":\"footer\",\"display\":\"1\",\"public_widget_id\":\"footer\"}}}}}' , `description` = '首页模板文件' , `is_public` = 0 , `list_order` = '5' WHERE `theme` = 'default' AND `file` = 'portal/about' [ RunTime:0.003039s ]
- SELECT * FROM `cmf_theme_file` WHERE `theme` = 'default' AND `file` = 'portal/article' LIMIT 1 [ RunTime:0.000141s ]
- UPDATE `cmf_theme_file` SET `theme` = 'default' , `action` = 'portal/Article/index' , `file` = 'portal/article' , `name` = '文章页' , `more` = '{\"widgets_blocks\":{\"top\":{\"title\":\"\\u9876\\u90e8\",\"widgets\":{\"top_nav_202206300003\":{\"title\":\"\\u9876\\u90e8\\u5bfc\\u822a\",\"name\":\"nav\",\"display\":\"1\",\"public_widget_id\":\"top_nav\",\"version\":\"1.0.0\",\"action\":\"\",\"vars\":{\"company_name\":\"ThinkCMF\",\"nav_id\":\"\"}}}},\"body_left\":{\"title\":\"\\u4e3b\\u4f53\\u5de6\",\"widgets\":{\"article_202206300003\":{\"title\":\"\\u6587\\u7ae0\\u5185\\u5bb9\",\"name\":\"article\",\"display\":\"1\",\"version\":\"1.0.0\",\"action\":\"portal\\/Article\\/index\",\"vars\":[]},\"article_last_news_202206300003\":{\"title\":\"\\u6700\\u65b0\\u8d44\\u8baf\",\"name\":\"last_news\",\"display\":\"1\",\"version\":\"1.0.0\",\"action\":\"\",\"vars\":{\"last_news_category_id\":\"\"}}}},\"body_right\":{\"title\":\"\\u4e3b\\u4f53\\u53f3\",\"widgets\":{\"article_side_hot_articles_202206300004\":{\"title\":\"\\u70ed\\u95e8\\u6587\\u7ae0\",\"name\":\"side_hot_articles\",\"display\":\"1\",\"version\":\"1.0.0\",\"action\":\"\",\"vars\":{\"hottest_articles_category_id\":\"\"}},\"article_side_last_articles_202206300004\":{\"title\":\"\\u6700\\u65b0\\u6587\\u7ae0\",\"name\":\"side_last_articles\",\"display\":\"1\",\"version\":\"1.0.0\",\"action\":\"\",\"vars\":{\"last_articles_category_id\":\"\"}}}},\"footer\":{\"title\":\"\\u5e95\\u90e8\",\"widgets\":{\"footer_202206300003\":{\"title\":\"\\u5e95\\u90e8\",\"name\":\"footer\",\"display\":\"1\",\"public_widget_id\":\"footer\",\"version\":\"1.0.0\",\"action\":\"\",\"vars\":[]}}}}}' , `config_more` = '{\"widgets_blocks\":{\"top\":{\"title\":\"\\u9876\\u90e8\",\"widgets\":{\"top_nav_202206300003\":{\"title\":\"\\u9876\\u90e8\\u5bfc\\u822a\",\"name\":\"nav\",\"display\":\"1\",\"public_widget_id\":\"top_nav\"}}},\"body_left\":{\"title\":\"\\u4e3b\\u4f53\\u5de6\",\"widgets\":{\"article_202206300003\":{\"title\":\"\\u6587\\u7ae0\\u5185\\u5bb9\",\"name\":\"article\",\"display\":\"1\"},\"article_last_news_202206300003\":{\"title\":\"\\u6700\\u65b0\\u8d44\\u8baf\",\"name\":\"last_news\",\"display\":\"1\"}}},\"body_right\":{\"title\":\"\\u4e3b\\u4f53\\u53f3\",\"widgets\":{\"article_side_hot_articles_202206300004\":{\"title\":\"\\u70ed\\u95e8\\u6587\\u7ae0\",\"name\":\"side_hot_articles\",\"display\":\"1\"},\"article_side_last_articles_202206300004\":{\"title\":\"\\u6700\\u65b0\\u6587\\u7ae0\",\"name\":\"side_last_articles\",\"display\":\"1\"}}},\"footer\":{\"title\":\"\\u5e95\\u90e8\",\"widgets\":{\"footer_202206300003\":{\"title\":\"\\u5e95\\u90e8\",\"name\":\"footer\",\"display\":\"1\",\"public_widget_id\":\"footer\"}}}}}' , `description` = '文章页模板文件' , `is_public` = 0 , `list_order` = '10' WHERE `theme` = 'default' AND `file` = 'portal/article' [ RunTime:0.003277s ]
- SELECT * FROM `cmf_theme_file` WHERE `theme` = 'default' AND `file` = 'portal/blog' LIMIT 1 [ RunTime:0.000140s ]
- UPDATE `cmf_theme_file` SET `theme` = 'default' , `action` = 'portal/Index/index' , `file` = 'portal/blog' , `name` = '首页' , `more` = '{\"widgets_blocks\":{\"top\":{\"title\":\"\\u9876\\u90e8\",\"widgets\":{\"top_nav_202206300003\":{\"title\":\"\\u9876\\u90e8\\u5bfc\\u822a\",\"name\":\"nav\",\"display\":\"1\",\"public_widget_id\":\"top_nav\",\"version\":\"1.0.0\",\"action\":\"\",\"vars\":{\"company_name\":\"ThinkCMF\",\"nav_id\":\"\"}}}},\"body\":{\"title\":\"\\u4e3b\\u4f53\",\"widgets\":{\"home_slider_202206300003\":{\"title\":\"\\u9996\\u9875\\u5e7b\\u706f\\u7247\",\"name\":\"slider\",\"display\":\"1\",\"version\":\"1.0.0\",\"action\":\"\",\"vars\":{\"slide_id\":\"\",\"fullscreen\":1}},\"home_features_202206300003\":{\"title\":\"\\u4ea7\\u54c1\\u7279\\u6027\",\"name\":\"features\",\"display\":\"1\",\"version\":\"1.0.0\",\"action\":\"\",\"vars\":{\"sub_title\":\"Quickly understand the ThinkCMF\",\"features\":[{\"title\":\"MVC\\u5206\\u5c42\\u6a21\\u5f0f\",\"icon\":\"bars\",\"content\":\"\\u4f7f\\u7528MVC\\u5e94\\u7528\\u7a0b\\u5e8f\\u88ab\\u5206\\u6210\\u4e09\\u4e2a\\u6838\\u5fc3\\u90e8\\u4ef6\\uff1a\\u6a21\\u578b\\uff08M\\uff09\\u3001\\u89c6\\u56fe\\uff08V\\uff09\\u3001\\u63a7\\u5236\\u5668\\uff08C\\uff09\\uff0c\\u4ed6\\u4e0d\\u662f\\u4e00\\u4e2a\\u65b0\\u7684\\u6982\\u5ff5\\uff0c\\u53ea\\u662fThinkCMF\\u5c06\\u5176\\u53d1\\u6325\\u5230\\u4e86\\u6781\\u81f4\\u3002\"},{\"title\":\"\\u7528\\u6237\\u7ba1\\u7406\",\"icon\":\"group\",\"content\":\"ThinkCMF\\u5185\\u7f6e\\u4e86\\u7075\\u6d3b\\u7684\\u7528\\u6237\\u7ba1\\u7406\\u65b9\\u5f0f\\uff0c\\u5e76\\u53ef\\u76f4\\u63a5\\u4e0e\\u7b2c\\u4e09\\u65b9\\u7ad9\\u70b9\\u8fdb\\u884c\\u4e92\\u8054\\u4e92\\u901a\\uff0c\\u5982\\u679c\\u4f60\\u613f\\u610f\\u751a\\u81f3\\u53ef\\u4ee5\\u5bf9\\u5355\\u4e2a\\u7528\\u6237\\u6216\\u7fa4\\u4f53\\u7528\\u6237\\u7684\\u884c\\u4e3a\\u8fdb\\u884c\\u8bb0\\u5f55\\u53ca\\u5206\\u4eab\\uff0c\\u4e3a\\u60a8\\u7684\\u8fd0\\u8425\\u51b3\\u7b56\\u63d0\\u4f9b\\u6709\\u6548\\u53c2\\u8003\\u6570\\u636e\\u3002\"},{\"title\":\"\\u4e91\\u7aef\\u90e8\\u7f72\",\"icon\":\"cloud\",\"content\":\"\\u901a\\u8fc7\\u9a71\\u52a8\\u7684\\u65b9\\u5f0f\\u53ef\\u4ee5\\u8f7b\\u677e\\u652f\\u6301\\u4e91\\u5e73\\u53f0\\u7684\\u90e8\\u7f72\\uff0c\\u8ba9\\u4f60\\u7684\\u7f51\\u7ad9\\u65e0\\u7f1d\\u8fc1\\u79fb\\uff0c\\u5185\\u7f6e\\u5df2\\u7ecf\\u652f\\u6301SAE\\u3001BAE\\uff0c\\u6b63\\u5f0f\\u7248\\u5c06\\u5bf9\\u4e91\\u7aef\\u90e8\\u7f72\\u8fdb\\u884c\\u8fdb\\u4e00\\u6b65\\u4f18\\u5316\\u3002\"},{\"title\":\"\\u5b89\\u5168\\u7b56\\u7565\",\"icon\":\"heart\",\"content\":\"\\u63d0\\u4f9b\\u7684\\u7a33\\u5065\\u7684\\u5b89\\u5168\\u7b56\\u7565\\uff0c\\u5305\\u62ec\\u5907\\u4efd\\u6062\\u590d\\uff0c\\u5bb9\\u9519\\uff0c\\u9632\\u6cbb\\u6076\\u610f\\u653b\\u51fb\\u767b\\u9646\\uff0c\\u7f51\\u9875\\u9632\\u7be1\\u6539\\u7b49\\u591a\\u9879\\u5b89\\u5168\\u7ba1\\u7406\\u529f\\u80fd\\uff0c\\u4fdd\\u8bc1\\u7cfb\\u7edf\\u5b89\\u5168\\uff0c\\u53ef\\u9760\\uff0c\\u7a33\\u5b9a\\u7684\\u8fd0\\u884c\\u3002\"},{\"title\":\"\\u5e94\\u7528\\u6a21\\u5757\\u5316\",\"icon\":\"cubes\",\"content\":\"\\u63d0\\u51fa\\u5168\\u65b0\\u7684\\u5e94\\u7528\\u6a21\\u5f0f\\u8fdb\\u884c\\u6269\\u5c55\\uff0c\\u4e0d\\u7ba1\\u662f\\u4f60\\u5f00\\u53d1\\u4e00\\u4e2a\\u5c0f\\u529f\\u80fd\\u8fd8\\u662f\\u4e00\\u4e2a\\u5168\\u65b0\\u7684\\u7ad9\\u70b9\\uff0c\\u5728ThinkCMF\\u4e2d\\u4f60\\u53ea\\u662f\\u589e\\u52a0\\u4e86\\u4e00\\u4e2aAPP\\uff0c\\u6bcf\\u4e2a\\u72ec\\u7acb\\u8fd0\\u884c\\u4e92\\u4e0d\\u5f71\\u54cd\\uff0c\\u4fbf\\u4e8e\\u7075\\u6d3b\\u6269\\u5c55\\u548c\\u4e8c\\u6b21\\u5f00\\u53d1\\u3002\"},{\"title\":\"\\u514d\\u8d39\\u5f00\\u6e90\",\"icon\":\"certificate\",\"content\":\"\\u4ee3\\u7801\\u9075\\u5faaApache2\\u5f00\\u6e90\\u534f\\u8bae\\uff0c\\u514d\\u8d39\\u4f7f\\u7528\\uff0c\\u5bf9\\u5546\\u4e1a\\u7528\\u6237\\u4e5f\\u65e0\\u4efb\\u4f55\\u9650\\u5236\\u3002\"}]}},\"home_last_news_202206300003\":{\"title\":\"\\u6700\\u65b0\\u8d44\\u8baf\",\"name\":\"last_news\",\"display\":\"1\",\"version\":\"1.0.0\",\"action\":\"\",\"vars\":{\"last_news_category_id\":\"\"}},\"home_last_news_202206300004\":{\"title\":\"\\u6700\\u65b0\\u8d44\\u8baf\",\"name\":\"last_news\",\"display\":\"1\",\"version\":\"1.0.0\",\"action\":\"\",\"vars\":{\"last_news_category_id\":\"\"}}}},\"footer\":{\"title\":\"\\u5e95\\u90e8\",\"widgets\":{\"home_footer_202206300003\":{\"title\":\"\\u5e95\\u90e8\",\"name\":\"footer\",\"display\":\"1\",\"public_widget_id\":\"footer\",\"version\":\"1.0.0\",\"action\":\"\",\"vars\":[]}}}}}' , `config_more` = '{\"widgets_blocks\":{\"top\":{\"title\":\"\\u9876\\u90e8\",\"widgets\":{\"top_nav_202206300003\":{\"title\":\"\\u9876\\u90e8\\u5bfc\\u822a\",\"name\":\"nav\",\"display\":\"1\",\"public_widget_id\":\"top_nav\"}}},\"body\":{\"title\":\"\\u4e3b\\u4f53\",\"widgets\":{\"home_slider_202206300003\":{\"title\":\"\\u9996\\u9875\\u5e7b\\u706f\\u7247\",\"name\":\"slider\",\"display\":\"1\"},\"home_features_202206300003\":{\"title\":\"\\u4ea7\\u54c1\\u7279\\u6027\",\"name\":\"features\",\"display\":\"1\"},\"home_last_news_202206300003\":{\"title\":\"\\u6700\\u65b0\\u8d44\\u8baf\",\"name\":\"last_news\",\"display\":\"1\"},\"home_last_news_202206300004\":{\"title\":\"\\u6700\\u65b0\\u8d44\\u8baf\",\"name\":\"last_news\",\"display\":\"1\"}}},\"footer\":{\"title\":\"\\u5e95\\u90e8\",\"widgets\":{\"home_footer_202206300003\":{\"title\":\"\\u5e95\\u90e8\",\"name\":\"footer\",\"display\":\"1\",\"public_widget_id\":\"footer\"}}}}}' , `description` = '首页模板文件' , `is_public` = 0 , `list_order` = '5' WHERE `theme` = 'default' AND `file` = 'portal/blog' [ RunTime:0.002848s ]
- SELECT * FROM `cmf_theme_file` WHERE `theme` = 'default' AND `file` = 'portal/blog_detail' LIMIT 1 [ RunTime:0.000164s ]
- UPDATE `cmf_theme_file` SET `theme` = 'default' , `action` = 'portal/Index/index' , `file` = 'portal/blog_detail' , `name` = '首页' , `more` = '{\"widgets_blocks\":{\"top\":{\"title\":\"\\u9876\\u90e8\",\"widgets\":{\"top_nav_202206300003\":{\"title\":\"\\u9876\\u90e8\\u5bfc\\u822a\",\"name\":\"nav\",\"display\":\"1\",\"public_widget_id\":\"top_nav\",\"version\":\"1.0.0\",\"action\":\"\",\"vars\":{\"company_name\":\"ThinkCMF\",\"nav_id\":\"\"}}}},\"body\":{\"title\":\"\\u4e3b\\u4f53\",\"widgets\":{\"home_slider_202206300003\":{\"title\":\"\\u9996\\u9875\\u5e7b\\u706f\\u7247\",\"name\":\"slider\",\"display\":\"1\",\"version\":\"1.0.0\",\"action\":\"\",\"vars\":{\"slide_id\":\"\",\"fullscreen\":1}},\"home_features_202206300003\":{\"title\":\"\\u4ea7\\u54c1\\u7279\\u6027\",\"name\":\"features\",\"display\":\"1\",\"version\":\"1.0.0\",\"action\":\"\",\"vars\":{\"sub_title\":\"Quickly understand the ThinkCMF\",\"features\":[{\"title\":\"MVC\\u5206\\u5c42\\u6a21\\u5f0f\",\"icon\":\"bars\",\"content\":\"\\u4f7f\\u7528MVC\\u5e94\\u7528\\u7a0b\\u5e8f\\u88ab\\u5206\\u6210\\u4e09\\u4e2a\\u6838\\u5fc3\\u90e8\\u4ef6\\uff1a\\u6a21\\u578b\\uff08M\\uff09\\u3001\\u89c6\\u56fe\\uff08V\\uff09\\u3001\\u63a7\\u5236\\u5668\\uff08C\\uff09\\uff0c\\u4ed6\\u4e0d\\u662f\\u4e00\\u4e2a\\u65b0\\u7684\\u6982\\u5ff5\\uff0c\\u53ea\\u662fThinkCMF\\u5c06\\u5176\\u53d1\\u6325\\u5230\\u4e86\\u6781\\u81f4\\u3002\"},{\"title\":\"\\u7528\\u6237\\u7ba1\\u7406\",\"icon\":\"group\",\"content\":\"ThinkCMF\\u5185\\u7f6e\\u4e86\\u7075\\u6d3b\\u7684\\u7528\\u6237\\u7ba1\\u7406\\u65b9\\u5f0f\\uff0c\\u5e76\\u53ef\\u76f4\\u63a5\\u4e0e\\u7b2c\\u4e09\\u65b9\\u7ad9\\u70b9\\u8fdb\\u884c\\u4e92\\u8054\\u4e92\\u901a\\uff0c\\u5982\\u679c\\u4f60\\u613f\\u610f\\u751a\\u81f3\\u53ef\\u4ee5\\u5bf9\\u5355\\u4e2a\\u7528\\u6237\\u6216\\u7fa4\\u4f53\\u7528\\u6237\\u7684\\u884c\\u4e3a\\u8fdb\\u884c\\u8bb0\\u5f55\\u53ca\\u5206\\u4eab\\uff0c\\u4e3a\\u60a8\\u7684\\u8fd0\\u8425\\u51b3\\u7b56\\u63d0\\u4f9b\\u6709\\u6548\\u53c2\\u8003\\u6570\\u636e\\u3002\"},{\"title\":\"\\u4e91\\u7aef\\u90e8\\u7f72\",\"icon\":\"cloud\",\"content\":\"\\u901a\\u8fc7\\u9a71\\u52a8\\u7684\\u65b9\\u5f0f\\u53ef\\u4ee5\\u8f7b\\u677e\\u652f\\u6301\\u4e91\\u5e73\\u53f0\\u7684\\u90e8\\u7f72\\uff0c\\u8ba9\\u4f60\\u7684\\u7f51\\u7ad9\\u65e0\\u7f1d\\u8fc1\\u79fb\\uff0c\\u5185\\u7f6e\\u5df2\\u7ecf\\u652f\\u6301SAE\\u3001BAE\\uff0c\\u6b63\\u5f0f\\u7248\\u5c06\\u5bf9\\u4e91\\u7aef\\u90e8\\u7f72\\u8fdb\\u884c\\u8fdb\\u4e00\\u6b65\\u4f18\\u5316\\u3002\"},{\"title\":\"\\u5b89\\u5168\\u7b56\\u7565\",\"icon\":\"heart\",\"content\":\"\\u63d0\\u4f9b\\u7684\\u7a33\\u5065\\u7684\\u5b89\\u5168\\u7b56\\u7565\\uff0c\\u5305\\u62ec\\u5907\\u4efd\\u6062\\u590d\\uff0c\\u5bb9\\u9519\\uff0c\\u9632\\u6cbb\\u6076\\u610f\\u653b\\u51fb\\u767b\\u9646\\uff0c\\u7f51\\u9875\\u9632\\u7be1\\u6539\\u7b49\\u591a\\u9879\\u5b89\\u5168\\u7ba1\\u7406\\u529f\\u80fd\\uff0c\\u4fdd\\u8bc1\\u7cfb\\u7edf\\u5b89\\u5168\\uff0c\\u53ef\\u9760\\uff0c\\u7a33\\u5b9a\\u7684\\u8fd0\\u884c\\u3002\"},{\"title\":\"\\u5e94\\u7528\\u6a21\\u5757\\u5316\",\"icon\":\"cubes\",\"content\":\"\\u63d0\\u51fa\\u5168\\u65b0\\u7684\\u5e94\\u7528\\u6a21\\u5f0f\\u8fdb\\u884c\\u6269\\u5c55\\uff0c\\u4e0d\\u7ba1\\u662f\\u4f60\\u5f00\\u53d1\\u4e00\\u4e2a\\u5c0f\\u529f\\u80fd\\u8fd8\\u662f\\u4e00\\u4e2a\\u5168\\u65b0\\u7684\\u7ad9\\u70b9\\uff0c\\u5728ThinkCMF\\u4e2d\\u4f60\\u53ea\\u662f\\u589e\\u52a0\\u4e86\\u4e00\\u4e2aAPP\\uff0c\\u6bcf\\u4e2a\\u72ec\\u7acb\\u8fd0\\u884c\\u4e92\\u4e0d\\u5f71\\u54cd\\uff0c\\u4fbf\\u4e8e\\u7075\\u6d3b\\u6269\\u5c55\\u548c\\u4e8c\\u6b21\\u5f00\\u53d1\\u3002\"},{\"title\":\"\\u514d\\u8d39\\u5f00\\u6e90\",\"icon\":\"certificate\",\"content\":\"\\u4ee3\\u7801\\u9075\\u5faaApache2\\u5f00\\u6e90\\u534f\\u8bae\\uff0c\\u514d\\u8d39\\u4f7f\\u7528\\uff0c\\u5bf9\\u5546\\u4e1a\\u7528\\u6237\\u4e5f\\u65e0\\u4efb\\u4f55\\u9650\\u5236\\u3002\"}]}},\"home_last_news_202206300003\":{\"title\":\"\\u6700\\u65b0\\u8d44\\u8baf\",\"name\":\"last_news\",\"display\":\"1\",\"version\":\"1.0.0\",\"action\":\"\",\"vars\":{\"last_news_category_id\":\"\"}},\"home_last_news_202206300004\":{\"title\":\"\\u6700\\u65b0\\u8d44\\u8baf\",\"name\":\"last_news\",\"display\":\"1\",\"version\":\"1.0.0\",\"action\":\"\",\"vars\":{\"last_news_category_id\":\"\"}}}},\"footer\":{\"title\":\"\\u5e95\\u90e8\",\"widgets\":{\"home_footer_202206300003\":{\"title\":\"\\u5e95\\u90e8\",\"name\":\"footer\",\"display\":\"1\",\"public_widget_id\":\"footer\",\"version\":\"1.0.0\",\"action\":\"\",\"vars\":[]}}}}}' , `config_more` = '{\"widgets_blocks\":{\"top\":{\"title\":\"\\u9876\\u90e8\",\"widgets\":{\"top_nav_202206300003\":{\"title\":\"\\u9876\\u90e8\\u5bfc\\u822a\",\"name\":\"nav\",\"display\":\"1\",\"public_widget_id\":\"top_nav\"}}},\"body\":{\"title\":\"\\u4e3b\\u4f53\",\"widgets\":{\"home_slider_202206300003\":{\"title\":\"\\u9996\\u9875\\u5e7b\\u706f\\u7247\",\"name\":\"slider\",\"display\":\"1\"},\"home_features_202206300003\":{\"title\":\"\\u4ea7\\u54c1\\u7279\\u6027\",\"name\":\"features\",\"display\":\"1\"},\"home_last_news_202206300003\":{\"title\":\"\\u6700\\u65b0\\u8d44\\u8baf\",\"name\":\"last_news\",\"display\":\"1\"},\"home_last_news_202206300004\":{\"title\":\"\\u6700\\u65b0\\u8d44\\u8baf\",\"name\":\"last_news\",\"display\":\"1\"}}},\"footer\":{\"title\":\"\\u5e95\\u90e8\",\"widgets\":{\"home_footer_202206300003\":{\"title\":\"\\u5e95\\u90e8\",\"name\":\"footer\",\"display\":\"1\",\"public_widget_id\":\"footer\"}}}}}' , `description` = '首页模板文件' , `is_public` = 0 , `list_order` = '5' WHERE `theme` = 'default' AND `file` = 'portal/blog_detail' [ RunTime:0.003110s ]
- SELECT * FROM `cmf_theme_file` WHERE `theme` = 'default' AND `file` = 'portal/category' LIMIT 1 [ RunTime:0.000141s ]
- UPDATE `cmf_theme_file` SET `theme` = 'default' , `action` = 'portal/Index/index' , `file` = 'portal/category' , `name` = '首页' , `more` = '{\"widgets_blocks\":{\"top\":{\"title\":\"\\u9876\\u90e8\",\"widgets\":{\"top_nav_202206300003\":{\"title\":\"\\u9876\\u90e8\\u5bfc\\u822a\",\"name\":\"nav\",\"display\":1,\"public_widget_id\":\"top_nav\",\"version\":\"1.0.0\",\"action\":\"\",\"vars\":{\"company_name\":\"ThinkCMF\",\"nav_id\":\"1\"},\"css\":{\"margin-top\":\"0\",\"margin-bottom\":\"15px\",\"margin-left\":\"0\",\"margin-right\":\"0\"}}}},\"body\":{\"title\":\"\\u4e3b\\u4f53\",\"widgets\":{\"home_slider_202206300003\":{\"title\":\"name\",\"name\":\"slider\",\"display\":1,\"version\":\"1.0.0\",\"action\":\"\",\"vars\":{\"slide_id\":31,\"fullscreen\":1},\"css\":{\"margin-top\":0,\"margin-bottom\":0,\"margin-left\":0,\"margin-right\":0}}}},\"footer\":{\"title\":\"\\u5e95\\u90e8\",\"widgets\":{\"home_footer_202206300003\":{\"title\":\"\\u5e95\\u90e8\",\"name\":\"footer\",\"display\":\"1\",\"public_widget_id\":\"footer\",\"version\":\"1.0.0\",\"action\":\"\",\"vars\":[]}}}}}' , `config_more` = '{\"widgets_blocks\":{\"top\":{\"title\":\"\\u9876\\u90e8\",\"widgets\":{\"top_nav_202206300003\":{\"title\":\"\\u9876\\u90e8\\u5bfc\\u822a\",\"name\":\"nav\",\"display\":\"1\",\"public_widget_id\":\"top_nav\"}}},\"body\":{\"title\":\"\\u4e3b\\u4f53\",\"widgets\":{\"home_slider_202206300003\":{\"title\":\"name\",\"name\":\"slider\",\"display\":1,\"version\":\"1.0.0\",\"action\":\"\",\"vars\":{\"slide_id\":31,\"fullscreen\":1},\"css\":{\"margin-top\":0,\"margin-bottom\":0,\"margin-left\":0,\"margin-right\":0}}}},\"footer\":{\"title\":\"\\u5e95\\u90e8\",\"widgets\":{\"home_footer_202206300003\":{\"title\":\"\\u5e95\\u90e8\",\"name\":\"footer\",\"display\":\"1\",\"public_widget_id\":\"footer\"}}}}}' , `description` = '首页模板文件' , `is_public` = 0 , `list_order` = '5' WHERE `theme` = 'default' AND `file` = 'portal/category' [ RunTime:0.003113s ]
- SELECT * FROM `cmf_theme_file` WHERE `theme` = 'default' AND `file` = 'portal/contact' LIMIT 1 [ RunTime:0.000256s ]
- UPDATE `cmf_theme_file` SET `theme` = 'default' , `action` = 'portal/Page/index' , `file` = 'portal/contact' , `name` = '联系我们页' , `more` = '{\"widgets_blocks\":{\"top\":{\"title\":\"\\u9876\\u90e8\",\"widgets\":{\"top_nav_202206300003\":{\"title\":\"\\u9876\\u90e8\\u5bfc\\u822a\",\"name\":\"nav\",\"display\":\"1\",\"public_widget_id\":\"top_nav\",\"version\":\"1.0.0\",\"action\":\"\",\"vars\":{\"company_name\":\"ThinkCMF\",\"nav_id\":\"\"}}}},\"body\":{\"title\":\"\\u4e3b\\u4f53\",\"widgets\":{\"contact_map_202206300003\":{\"title\":\"\\u8054\\u7cfb\\u5730\\u56fe\",\"name\":\"tianditu_contact\",\"display\":\"1\",\"version\":\"1.0.0\",\"action\":\"\",\"vars\":{\"map_secret_key\":\"\",\"map_info_window_text\":\"ThinkCMF<br\\/><span class=\'\'>\\u5730\\u5740\\uff1a\\u4e0a\\u6d77\\u5e02\\u5f90\\u6c47\\u533a\\u659c\\u571f\\u8def2601\\u53f7<\\/span>\",\"map_info_window_rich_text\":\"ThinkCMF<br\\/><span class=\'\'>\\u5730\\u5740\\uff1a\\u4e0a\\u6d77\\u5e02\\u5f90\\u6c47\\u533a\\u659c\\u571f\\u8def2601\\u53f7<\\/span>\",\"map_info_window_rich_text2\":\"ThinkCMF<br\\/><span class=\'\'>\\u5730\\u5740\\uff1a\\u4e0a\\u6d77\\u5e02\\u5f90\\u6c47\\u533a\\u659c\\u571f\\u8def2601\\u53f7<\\/span>\",\"company_location\":\"\",\"fullscreen\":1}},\"contact_guestbook_202206300003\":{\"title\":\"\\u5ba2\\u6237\\u8054\\u7cfb\",\"name\":\"guestbook\",\"display\":\"1\",\"version\":\"1.0.0\",\"action\":\"\",\"vars\":{\"address_cn\":\"\\u4e0a\\u6d77\\u5e02\\u5f90\\u6c47\\u533a\\u659c\\u571f\\u8def0001\\u53f7\",\"address_en\":\"NO.0001 Xie Tu Road, Shanghai China\",\"email\":\"catman@thinkcmf.com\",\"phone_cn\":\"021 1000 0001\",\"phone_en\":\"+8621 1000 0001\",\"qq\":\"478519726\"}}}},\"footer\":{\"title\":\"\\u5e95\\u90e8\",\"widgets\":{\"contact_footer_202206300003\":{\"title\":\"\\u5e95\\u90e8\",\"name\":\"footer\",\"display\":\"1\",\"public_widget_id\":\"footer\",\"version\":\"1.0.0\",\"action\":\"\",\"vars\":[]}}}}}' , `config_more` = '{\"widgets_blocks\":{\"top\":{\"title\":\"\\u9876\\u90e8\",\"widgets\":{\"top_nav_202206300003\":{\"title\":\"\\u9876\\u90e8\\u5bfc\\u822a\",\"name\":\"nav\",\"display\":\"1\",\"public_widget_id\":\"top_nav\"}}},\"body\":{\"title\":\"\\u4e3b\\u4f53\",\"widgets\":{\"contact_map_202206300003\":{\"title\":\"\\u8054\\u7cfb\\u5730\\u56fe\",\"name\":\"tianditu_contact\",\"display\":\"1\"},\"contact_guestbook_202206300003\":{\"title\":\"\\u5ba2\\u6237\\u8054\\u7cfb\",\"name\":\"guestbook\",\"display\":\"1\"}}},\"footer\":{\"title\":\"\\u5e95\\u90e8\",\"widgets\":{\"contact_footer_202206300003\":{\"title\":\"\\u5e95\\u90e8\",\"name\":\"footer\",\"display\":\"1\",\"public_widget_id\":\"footer\"}}}}}' , `description` = '联系我们页模板文件' , `is_public` = 0 , `list_order` = '10' WHERE `theme` = 'default' AND `file` = 'portal/contact' [ RunTime:0.003962s ]
- SELECT * FROM `cmf_theme_file` WHERE `theme` = 'default' AND `file` = 'portal/index' LIMIT 1 [ RunTime:0.000199s ]
- UPDATE `cmf_theme_file` SET `theme` = 'default' , `action` = 'portal/Index/index' , `file` = 'portal/index' , `name` = '首页' , `more` = '{\"widgets_blocks\":{\"top\":{\"title\":\"\\u9876\\u90e8\",\"widgets\":{\"top_nav_202206300003\":{\"title\":\"\\u9876\\u90e8\\u5bfc\\u822a\",\"name\":\"nav\",\"display\":\"1\",\"public_widget_id\":\"top_nav\",\"version\":\"1.0.0\",\"action\":\"\",\"vars\":{\"company_name\":\"ThinkCMF\",\"nav_id\":\"\"}}}},\"body\":{\"title\":\"\\u4e3b\\u4f53\",\"widgets\":{\"home_slider_202206300003\":{\"title\":\"name\",\"name\":\"slider\",\"display\":1,\"version\":\"1.0.0\",\"action\":\"\",\"vars\":{\"slide_id\":\"32\",\"fullscreen\":1},\"css\":{\"margin-top\":0,\"margin-bottom\":0,\"margin-left\":0,\"margin-right\":0}}}},\"footer\":{\"title\":\"\\u5e95\\u90e8\",\"widgets\":{\"home_footer_202206300003\":{\"title\":\"\\u5e95\\u90e8\",\"name\":\"footer\",\"display\":\"1\",\"public_widget_id\":\"footer\",\"version\":\"1.0.0\",\"action\":\"\",\"vars\":[]}}}}}' , `config_more` = '{\"widgets_blocks\":{\"top\":{\"title\":\"\\u9876\\u90e8\",\"widgets\":{\"top_nav_202206300003\":{\"title\":\"\\u9876\\u90e8\\u5bfc\\u822a\",\"name\":\"nav\",\"display\":\"1\",\"public_widget_id\":\"top_nav\"}}},\"body\":{\"title\":\"\\u4e3b\\u4f53\",\"widgets\":{\"home_slider_202206300003\":{\"title\":\"name\",\"name\":\"slider\",\"display\":1,\"version\":\"1.0.0\",\"action\":\"\",\"vars\":{\"slide_id\":\"32\",\"fullscreen\":1},\"css\":{\"margin-top\":0,\"margin-bottom\":0,\"margin-left\":0,\"margin-right\":0}}}},\"footer\":{\"title\":\"\\u5e95\\u90e8\",\"widgets\":{\"home_footer_202206300003\":{\"title\":\"\\u5e95\\u90e8\",\"name\":\"footer\",\"display\":\"1\",\"public_widget_id\":\"footer\"}}}}}' , `description` = '首页模板文件' , `is_public` = 0 , `list_order` = '5' WHERE `theme` = 'default' AND `file` = 'portal/index' [ RunTime:0.002911s ]
- SELECT * FROM `cmf_theme_file` WHERE `theme` = 'default' AND `file` = 'portal/list' LIMIT 1 [ RunTime:0.000166s ]
- UPDATE `cmf_theme_file` SET `theme` = 'default' , `action` = 'portal/Product/category' , `file` = 'portal/list' , `name` = '文章列表页' , `more` = '{\"widgets_blocks\":{\"top\":{\"title\":\"\\u9876\\u90e8\",\"widgets\":{\"top_nav_202206300003\":{\"title\":\"\\u9876\\u90e8\\u5bfc\\u822a\",\"name\":\"nav\",\"display\":\"1\",\"public_widget_id\":\"top_nav\",\"version\":\"1.0.0\",\"action\":\"\",\"vars\":{\"company_name\":\"ThinkCMF\",\"nav_id\":\"\"}}}},\"body_left\":{\"title\":\"\\u4e3b\\u4f53\\u5de6\",\"widgets\":{\"list_articles_202206300003\":{\"title\":\"\\u6587\\u7ae0\\u5217\\u8868\",\"name\":\"list_articles\",\"display\":\"1\",\"version\":\"1.0.0\",\"action\":\"portal\\/List\\/index\",\"vars\":[]},\"list_last_news_202206300003\":{\"title\":\"\\u6700\\u65b0\\u8d44\\u8baf\",\"name\":\"last_news\",\"display\":\"1\",\"version\":\"1.0.0\",\"action\":\"\",\"vars\":{\"last_news_category_id\":\"\"}}}},\"body_right\":{\"title\":\"\\u4e3b\\u4f53\\u53f3\",\"widgets\":{\"list_side_hot_articles_202206300004\":{\"title\":\"\\u70ed\\u95e8\\u6587\\u7ae0\",\"name\":\"side_hot_articles\",\"display\":\"1\",\"version\":\"1.0.0\",\"action\":\"\",\"vars\":{\"hottest_articles_category_id\":\"\"}},\"list_side_last_articles_202206300004\":{\"title\":\"\\u6700\\u65b0\\u6587\\u7ae0\",\"name\":\"side_last_articles\",\"display\":\"1\",\"version\":\"1.0.0\",\"action\":\"\",\"vars\":{\"last_articles_category_id\":\"\"}}}},\"footer\":{\"title\":\"\\u5e95\\u90e8\",\"widgets\":{\"home_footer_202206300003\":{\"title\":\"\\u5e95\\u90e8\",\"name\":\"footer\",\"display\":\"1\",\"public_widget_id\":\"footer\",\"version\":\"1.0.0\",\"action\":\"\",\"vars\":[]}}}}}' , `config_more` = '{\"widgets_blocks\":{\"top\":{\"title\":\"\\u9876\\u90e8\",\"widgets\":{\"top_nav_202206300003\":{\"title\":\"\\u9876\\u90e8\\u5bfc\\u822a\",\"name\":\"nav\",\"display\":\"1\",\"public_widget_id\":\"top_nav\"}}},\"body_left\":{\"title\":\"\\u4e3b\\u4f53\\u5de6\",\"widgets\":{\"list_articles_202206300003\":{\"title\":\"\\u6587\\u7ae0\\u5217\\u8868\",\"name\":\"list_articles\",\"display\":\"1\"},\"list_last_news_202206300003\":{\"title\":\"\\u6700\\u65b0\\u8d44\\u8baf\",\"name\":\"last_news\",\"display\":\"1\"}}},\"body_right\":{\"title\":\"\\u4e3b\\u4f53\\u53f3\",\"widgets\":{\"list_side_hot_articles_202206300004\":{\"title\":\"\\u70ed\\u95e8\\u6587\\u7ae0\",\"name\":\"side_hot_articles\",\"display\":\"1\"},\"list_side_last_articles_202206300004\":{\"title\":\"\\u6700\\u65b0\\u6587\\u7ae0\",\"name\":\"side_last_articles\",\"display\":\"1\"}}},\"footer\":{\"title\":\"\\u5e95\\u90e8\",\"widgets\":{\"home_footer_202206300003\":{\"title\":\"\\u5e95\\u90e8\",\"name\":\"footer\",\"display\":\"1\",\"public_widget_id\":\"footer\"}}}}}' , `description` = '文章列表模板文件' , `is_public` = 0 , `list_order` = '10' WHERE `theme` = 'default' AND `file` = 'portal/list' [ RunTime:0.003296s ]
- SELECT * FROM `cmf_theme_file` WHERE `theme` = 'default' AND `file` = 'portal/list_filter' LIMIT 1 [ RunTime:0.000158s ]
- UPDATE `cmf_theme_file` SET `theme` = 'default' , `action` = 'portal/List/index' , `file` = 'portal/list_filter' , `name` = '文章带过滤器列表页' , `more` = '{\"widgets_blocks\":{\"top\":{\"title\":\"\\u9876\\u90e8\",\"widgets\":{\"top_nav_202206300003\":{\"title\":\"\\u9876\\u90e8\\u5bfc\\u822a\",\"name\":\"nav\",\"display\":\"1\",\"public_widget_id\":\"top_nav\",\"version\":\"1.0.0\",\"action\":\"\",\"vars\":{\"company_name\":\"ThinkCMF\",\"nav_id\":\"\"}}}},\"body_left\":{\"title\":\"\\u4e3b\\u4f53\\u5de6\",\"widgets\":{\"list_articles_202206300003\":{\"title\":\"\\u6587\\u7ae0\\u5217\\u8868\",\"name\":\"list_filter_articles\",\"display\":\"1\",\"version\":\"1.0.0\",\"action\":\"portal\\/List\\/index\",\"vars\":[]},\"list_last_news_202206300003\":{\"title\":\"\\u6700\\u65b0\\u8d44\\u8baf\",\"name\":\"last_news\",\"display\":\"1\",\"version\":\"1.0.0\",\"action\":\"\",\"vars\":{\"last_news_category_id\":\"\"}}}},\"body_right\":{\"title\":\"\\u4e3b\\u4f53\\u53f3\",\"widgets\":{\"list_side_hot_articles_202206300004\":{\"title\":\"\\u70ed\\u95e8\\u6587\\u7ae0\",\"name\":\"side_hot_articles\",\"display\":\"1\",\"version\":\"1.0.0\",\"action\":\"\",\"vars\":{\"hottest_articles_category_id\":\"\"}},\"list_side_last_articles_202206300004\":{\"title\":\"\\u6700\\u65b0\\u6587\\u7ae0\",\"name\":\"side_last_articles\",\"display\":\"1\",\"version\":\"1.0.0\",\"action\":\"\",\"vars\":{\"last_articles_category_id\":\"\"}}}},\"footer\":{\"title\":\"\\u5e95\\u90e8\",\"widgets\":{\"home_footer_202206300003\":{\"title\":\"\\u5e95\\u90e8\",\"name\":\"footer\",\"display\":\"1\",\"public_widget_id\":\"footer\",\"version\":\"1.0.0\",\"action\":\"\",\"vars\":[]}}}}}' , `config_more` = '{\"widgets_blocks\":{\"top\":{\"title\":\"\\u9876\\u90e8\",\"widgets\":{\"top_nav_202206300003\":{\"title\":\"\\u9876\\u90e8\\u5bfc\\u822a\",\"name\":\"nav\",\"display\":\"1\",\"public_widget_id\":\"top_nav\"}}},\"body_left\":{\"title\":\"\\u4e3b\\u4f53\\u5de6\",\"widgets\":{\"list_articles_202206300003\":{\"title\":\"\\u6587\\u7ae0\\u5217\\u8868\",\"name\":\"list_filter_articles\",\"display\":\"1\"},\"list_last_news_202206300003\":{\"title\":\"\\u6700\\u65b0\\u8d44\\u8baf\",\"name\":\"last_news\",\"display\":\"1\"}}},\"body_right\":{\"title\":\"\\u4e3b\\u4f53\\u53f3\",\"widgets\":{\"list_side_hot_articles_202206300004\":{\"title\":\"\\u70ed\\u95e8\\u6587\\u7ae0\",\"name\":\"side_hot_articles\",\"display\":\"1\"},\"list_side_last_articles_202206300004\":{\"title\":\"\\u6700\\u65b0\\u6587\\u7ae0\",\"name\":\"side_last_articles\",\"display\":\"1\"}}},\"footer\":{\"title\":\"\\u5e95\\u90e8\",\"widgets\":{\"home_footer_202206300003\":{\"title\":\"\\u5e95\\u90e8\",\"name\":\"footer\",\"display\":\"1\",\"public_widget_id\":\"footer\"}}}}}' , `description` = '文章列表模板文件' , `is_public` = 0 , `list_order` = '10' WHERE `theme` = 'default' AND `file` = 'portal/list_filter' [ RunTime:0.002847s ]
- SELECT * FROM `cmf_theme_file` WHERE `theme` = 'default' AND `file` = 'portal/page' LIMIT 1 [ RunTime:0.000215s ]
- UPDATE `cmf_theme_file` SET `theme` = 'default' , `action` = 'portal/Page/index' , `file` = 'portal/page' , `name` = '单页面' , `more` = '{\"widgets_blocks\":{\"top\":{\"title\":\"\\u9876\\u90e8\",\"widgets\":{\"top_nav_202206300003\":{\"title\":\"\\u9876\\u90e8\\u5bfc\\u822a\",\"name\":\"nav\",\"display\":\"1\",\"public_widget_id\":\"top_nav\",\"version\":\"1.0.0\",\"action\":\"\",\"vars\":{\"company_name\":\"ThinkCMF\",\"nav_id\":\"\"}}}},\"body_left\":{\"title\":\"\\u4e3b\\u4f53\\u5de6\",\"widgets\":{\"page_202206300003\":{\"title\":\"\\u9875\\u9762\\u5185\\u5bb9\",\"name\":\"page\",\"display\":\"1\",\"version\":\"1.0.0\",\"action\":\"portal\\/Page\\/index\",\"vars\":[]}}},\"body_right\":{\"title\":\"\\u4e3b\\u4f53\\u53f3\",\"widgets\":{\"page_side_hot_articles_202206300004\":{\"title\":\"\\u70ed\\u95e8\\u6587\\u7ae0\",\"name\":\"side_hot_articles\",\"display\":\"1\",\"version\":\"1.0.0\",\"action\":\"\",\"vars\":{\"hottest_articles_category_id\":\"\"}},\"page_side_last_articles_202206300004\":{\"title\":\"\\u6700\\u65b0\\u6587\\u7ae0\",\"name\":\"side_last_articles\",\"display\":\"1\",\"version\":\"1.0.0\",\"action\":\"\",\"vars\":{\"last_articles_category_id\":\"\"}}}},\"footer\":{\"title\":\"\\u5e95\\u90e8\",\"widgets\":{\"footer_202206300003\":{\"title\":\"\\u5e95\\u90e8\",\"name\":\"footer\",\"display\":\"1\",\"public_widget_id\":\"footer\",\"version\":\"1.0.0\",\"action\":\"\",\"vars\":{\"company_name\":\"ThinkCMF\",\"nav_id\":\"2\"}}}}},\"edited_by_designer\":1}' , `config_more` = '{\"widgets_blocks\":{\"top\":{\"title\":\"\\u9876\\u90e8\",\"widgets\":{\"top_nav_202206300003\":{\"title\":\"\\u9876\\u90e8\\u5bfc\\u822a\",\"name\":\"nav\",\"display\":\"1\",\"public_widget_id\":\"top_nav\"}}},\"body_left\":{\"title\":\"\\u4e3b\\u4f53\\u5de6\",\"widgets\":{\"page_202206300003\":{\"title\":\"\\u9875\\u9762\\u5185\\u5bb9\",\"name\":\"page\",\"display\":\"1\"},\"page_last_news_202206300003\":{\"title\":\"\\u6700\\u65b0\\u8d44\\u8baf1\",\"name\":\"last_news\",\"display\":\"0\"}}},\"body_right\":{\"title\":\"\\u4e3b\\u4f53\\u53f3\",\"widgets\":{\"page_side_hot_articles_202206300004\":{\"title\":\"\\u70ed\\u95e8\\u6587\\u7ae0\",\"name\":\"side_hot_articles\",\"display\":\"1\"},\"page_side_last_articles_202206300004\":{\"title\":\"\\u6700\\u65b0\\u6587\\u7ae0\",\"name\":\"side_last_articles\",\"display\":\"1\"}}},\"footer\":{\"title\":\"\\u5e95\\u90e8\",\"widgets\":{\"footer_202206300003\":{\"title\":\"\\u5e95\\u90e8\",\"name\":\"footer\",\"display\":\"1\",\"public_widget_id\":\"footer\"}}}}}' , `description` = '单页面模板文件' , `is_public` = 0 , `list_order` = '10' WHERE `theme` = 'default' AND `file` = 'portal/page' [ RunTime:0.003408s ]
- SELECT * FROM `cmf_theme_file` WHERE `theme` = 'default' AND `file` = 'portal/product' LIMIT 1 [ RunTime:0.000187s ]
- UPDATE `cmf_theme_file` SET `theme` = 'default' , `action` = 'portal/Index/index' , `file` = 'portal/product' , `name` = '首页' , `more` = '{\"widgets_blocks\":{\"top\":{\"title\":\"\\u9876\\u90e8\",\"widgets\":{\"top_nav_202206300003\":{\"title\":\"\\u9876\\u90e8\\u5bfc\\u822a\",\"name\":\"nav\",\"display\":\"1\",\"public_widget_id\":\"top_nav\",\"version\":\"1.0.0\",\"action\":\"\",\"vars\":{\"company_name\":\"ThinkCMF\",\"nav_id\":\"\"}}}},\"body\":{\"title\":\"\\u4e3b\\u4f53\",\"widgets\":{\"home_slider_202206300003\":{\"title\":\"\\u9996\\u9875\\u5e7b\\u706f\\u7247\",\"name\":\"slider\",\"display\":\"1\",\"version\":\"1.0.0\",\"action\":\"\",\"vars\":{\"slide_id\":\"\",\"fullscreen\":1}},\"home_features_202206300003\":{\"title\":\"\\u4ea7\\u54c1\\u7279\\u6027\",\"name\":\"features\",\"display\":\"1\",\"version\":\"1.0.0\",\"action\":\"\",\"vars\":{\"sub_title\":\"Quickly understand the ThinkCMF\",\"features\":[{\"title\":\"MVC\\u5206\\u5c42\\u6a21\\u5f0f\",\"icon\":\"bars\",\"content\":\"\\u4f7f\\u7528MVC\\u5e94\\u7528\\u7a0b\\u5e8f\\u88ab\\u5206\\u6210\\u4e09\\u4e2a\\u6838\\u5fc3\\u90e8\\u4ef6\\uff1a\\u6a21\\u578b\\uff08M\\uff09\\u3001\\u89c6\\u56fe\\uff08V\\uff09\\u3001\\u63a7\\u5236\\u5668\\uff08C\\uff09\\uff0c\\u4ed6\\u4e0d\\u662f\\u4e00\\u4e2a\\u65b0\\u7684\\u6982\\u5ff5\\uff0c\\u53ea\\u662fThinkCMF\\u5c06\\u5176\\u53d1\\u6325\\u5230\\u4e86\\u6781\\u81f4\\u3002\"},{\"title\":\"\\u7528\\u6237\\u7ba1\\u7406\",\"icon\":\"group\",\"content\":\"ThinkCMF\\u5185\\u7f6e\\u4e86\\u7075\\u6d3b\\u7684\\u7528\\u6237\\u7ba1\\u7406\\u65b9\\u5f0f\\uff0c\\u5e76\\u53ef\\u76f4\\u63a5\\u4e0e\\u7b2c\\u4e09\\u65b9\\u7ad9\\u70b9\\u8fdb\\u884c\\u4e92\\u8054\\u4e92\\u901a\\uff0c\\u5982\\u679c\\u4f60\\u613f\\u610f\\u751a\\u81f3\\u53ef\\u4ee5\\u5bf9\\u5355\\u4e2a\\u7528\\u6237\\u6216\\u7fa4\\u4f53\\u7528\\u6237\\u7684\\u884c\\u4e3a\\u8fdb\\u884c\\u8bb0\\u5f55\\u53ca\\u5206\\u4eab\\uff0c\\u4e3a\\u60a8\\u7684\\u8fd0\\u8425\\u51b3\\u7b56\\u63d0\\u4f9b\\u6709\\u6548\\u53c2\\u8003\\u6570\\u636e\\u3002\"},{\"title\":\"\\u4e91\\u7aef\\u90e8\\u7f72\",\"icon\":\"cloud\",\"content\":\"\\u901a\\u8fc7\\u9a71\\u52a8\\u7684\\u65b9\\u5f0f\\u53ef\\u4ee5\\u8f7b\\u677e\\u652f\\u6301\\u4e91\\u5e73\\u53f0\\u7684\\u90e8\\u7f72\\uff0c\\u8ba9\\u4f60\\u7684\\u7f51\\u7ad9\\u65e0\\u7f1d\\u8fc1\\u79fb\\uff0c\\u5185\\u7f6e\\u5df2\\u7ecf\\u652f\\u6301SAE\\u3001BAE\\uff0c\\u6b63\\u5f0f\\u7248\\u5c06\\u5bf9\\u4e91\\u7aef\\u90e8\\u7f72\\u8fdb\\u884c\\u8fdb\\u4e00\\u6b65\\u4f18\\u5316\\u3002\"},{\"title\":\"\\u5b89\\u5168\\u7b56\\u7565\",\"icon\":\"heart\",\"content\":\"\\u63d0\\u4f9b\\u7684\\u7a33\\u5065\\u7684\\u5b89\\u5168\\u7b56\\u7565\\uff0c\\u5305\\u62ec\\u5907\\u4efd\\u6062\\u590d\\uff0c\\u5bb9\\u9519\\uff0c\\u9632\\u6cbb\\u6076\\u610f\\u653b\\u51fb\\u767b\\u9646\\uff0c\\u7f51\\u9875\\u9632\\u7be1\\u6539\\u7b49\\u591a\\u9879\\u5b89\\u5168\\u7ba1\\u7406\\u529f\\u80fd\\uff0c\\u4fdd\\u8bc1\\u7cfb\\u7edf\\u5b89\\u5168\\uff0c\\u53ef\\u9760\\uff0c\\u7a33\\u5b9a\\u7684\\u8fd0\\u884c\\u3002\"},{\"title\":\"\\u5e94\\u7528\\u6a21\\u5757\\u5316\",\"icon\":\"cubes\",\"content\":\"\\u63d0\\u51fa\\u5168\\u65b0\\u7684\\u5e94\\u7528\\u6a21\\u5f0f\\u8fdb\\u884c\\u6269\\u5c55\\uff0c\\u4e0d\\u7ba1\\u662f\\u4f60\\u5f00\\u53d1\\u4e00\\u4e2a\\u5c0f\\u529f\\u80fd\\u8fd8\\u662f\\u4e00\\u4e2a\\u5168\\u65b0\\u7684\\u7ad9\\u70b9\\uff0c\\u5728ThinkCMF\\u4e2d\\u4f60\\u53ea\\u662f\\u589e\\u52a0\\u4e86\\u4e00\\u4e2aAPP\\uff0c\\u6bcf\\u4e2a\\u72ec\\u7acb\\u8fd0\\u884c\\u4e92\\u4e0d\\u5f71\\u54cd\\uff0c\\u4fbf\\u4e8e\\u7075\\u6d3b\\u6269\\u5c55\\u548c\\u4e8c\\u6b21\\u5f00\\u53d1\\u3002\"},{\"title\":\"\\u514d\\u8d39\\u5f00\\u6e90\",\"icon\":\"certificate\",\"content\":\"\\u4ee3\\u7801\\u9075\\u5faaApache2\\u5f00\\u6e90\\u534f\\u8bae\\uff0c\\u514d\\u8d39\\u4f7f\\u7528\\uff0c\\u5bf9\\u5546\\u4e1a\\u7528\\u6237\\u4e5f\\u65e0\\u4efb\\u4f55\\u9650\\u5236\\u3002\"}]}},\"home_last_news_202206300003\":{\"title\":\"\\u6700\\u65b0\\u8d44\\u8baf\",\"name\":\"last_news\",\"display\":\"1\",\"version\":\"1.0.0\",\"action\":\"\",\"vars\":{\"last_news_category_id\":\"\"}},\"home_last_news_202206300004\":{\"title\":\"\\u6700\\u65b0\\u8d44\\u8baf\",\"name\":\"last_news\",\"display\":\"1\",\"version\":\"1.0.0\",\"action\":\"\",\"vars\":{\"last_news_category_id\":\"\"}}}},\"footer\":{\"title\":\"\\u5e95\\u90e8\",\"widgets\":{\"home_footer_202206300003\":{\"title\":\"\\u5e95\\u90e8\",\"name\":\"footer\",\"display\":\"1\",\"public_widget_id\":\"footer\",\"version\":\"1.0.0\",\"action\":\"\",\"vars\":[]}}}}}' , `config_more` = '{\"widgets_blocks\":{\"top\":{\"title\":\"\\u9876\\u90e8\",\"widgets\":{\"top_nav_202206300003\":{\"title\":\"\\u9876\\u90e8\\u5bfc\\u822a\",\"name\":\"nav\",\"display\":\"1\",\"public_widget_id\":\"top_nav\"}}},\"body\":{\"title\":\"\\u4e3b\\u4f53\",\"widgets\":{\"home_slider_202206300003\":{\"title\":\"\\u9996\\u9875\\u5e7b\\u706f\\u7247\",\"name\":\"slider\",\"display\":\"1\"},\"home_features_202206300003\":{\"title\":\"\\u4ea7\\u54c1\\u7279\\u6027\",\"name\":\"features\",\"display\":\"1\"},\"home_last_news_202206300003\":{\"title\":\"\\u6700\\u65b0\\u8d44\\u8baf\",\"name\":\"last_news\",\"display\":\"1\"},\"home_last_news_202206300004\":{\"title\":\"\\u6700\\u65b0\\u8d44\\u8baf\",\"name\":\"last_news\",\"display\":\"1\"}}},\"footer\":{\"title\":\"\\u5e95\\u90e8\",\"widgets\":{\"home_footer_202206300003\":{\"title\":\"\\u5e95\\u90e8\",\"name\":\"footer\",\"display\":\"1\",\"public_widget_id\":\"footer\"}}}}}' , `description` = '首页模板文件' , `is_public` = 0 , `list_order` = '5' WHERE `theme` = 'default' AND `file` = 'portal/product' [ RunTime:0.003500s ]
- SELECT * FROM `cmf_theme_file` WHERE `theme` = 'default' AND `file` = 'portal/search' LIMIT 1 [ RunTime:0.000211s ]
- UPDATE `cmf_theme_file` SET `theme` = 'default' , `action` = 'portal/Index/index' , `file` = 'portal/search' , `name` = '首页' , `more` = '{\"widgets_blocks\":{\"top\":{\"title\":\"\\u9876\\u90e8\",\"widgets\":{\"top_nav_202206300003\":{\"title\":\"\\u9876\\u90e8\\u5bfc\\u822a\",\"name\":\"nav\",\"display\":\"1\",\"public_widget_id\":\"top_nav\",\"version\":\"1.0.0\",\"action\":\"\",\"vars\":{\"company_name\":\"ThinkCMF\",\"nav_id\":\"\"}}}},\"body\":{\"title\":\"\\u4e3b\\u4f53\",\"widgets\":{\"home_slider_202206300003\":{\"title\":\"\\u9996\\u9875\\u5e7b\\u706f\\u7247\",\"name\":\"slider\",\"display\":\"1\",\"version\":\"1.0.0\",\"action\":\"\",\"vars\":{\"slide_id\":\"\",\"fullscreen\":1}},\"home_features_202206300003\":{\"title\":\"\\u4ea7\\u54c1\\u7279\\u6027\",\"name\":\"features\",\"display\":\"1\",\"version\":\"1.0.0\",\"action\":\"\",\"vars\":{\"sub_title\":\"Quickly understand the ThinkCMF\",\"features\":[{\"title\":\"MVC\\u5206\\u5c42\\u6a21\\u5f0f\",\"icon\":\"bars\",\"content\":\"\\u4f7f\\u7528MVC\\u5e94\\u7528\\u7a0b\\u5e8f\\u88ab\\u5206\\u6210\\u4e09\\u4e2a\\u6838\\u5fc3\\u90e8\\u4ef6\\uff1a\\u6a21\\u578b\\uff08M\\uff09\\u3001\\u89c6\\u56fe\\uff08V\\uff09\\u3001\\u63a7\\u5236\\u5668\\uff08C\\uff09\\uff0c\\u4ed6\\u4e0d\\u662f\\u4e00\\u4e2a\\u65b0\\u7684\\u6982\\u5ff5\\uff0c\\u53ea\\u662fThinkCMF\\u5c06\\u5176\\u53d1\\u6325\\u5230\\u4e86\\u6781\\u81f4\\u3002\"},{\"title\":\"\\u7528\\u6237\\u7ba1\\u7406\",\"icon\":\"group\",\"content\":\"ThinkCMF\\u5185\\u7f6e\\u4e86\\u7075\\u6d3b\\u7684\\u7528\\u6237\\u7ba1\\u7406\\u65b9\\u5f0f\\uff0c\\u5e76\\u53ef\\u76f4\\u63a5\\u4e0e\\u7b2c\\u4e09\\u65b9\\u7ad9\\u70b9\\u8fdb\\u884c\\u4e92\\u8054\\u4e92\\u901a\\uff0c\\u5982\\u679c\\u4f60\\u613f\\u610f\\u751a\\u81f3\\u53ef\\u4ee5\\u5bf9\\u5355\\u4e2a\\u7528\\u6237\\u6216\\u7fa4\\u4f53\\u7528\\u6237\\u7684\\u884c\\u4e3a\\u8fdb\\u884c\\u8bb0\\u5f55\\u53ca\\u5206\\u4eab\\uff0c\\u4e3a\\u60a8\\u7684\\u8fd0\\u8425\\u51b3\\u7b56\\u63d0\\u4f9b\\u6709\\u6548\\u53c2\\u8003\\u6570\\u636e\\u3002\"},{\"title\":\"\\u4e91\\u7aef\\u90e8\\u7f72\",\"icon\":\"cloud\",\"content\":\"\\u901a\\u8fc7\\u9a71\\u52a8\\u7684\\u65b9\\u5f0f\\u53ef\\u4ee5\\u8f7b\\u677e\\u652f\\u6301\\u4e91\\u5e73\\u53f0\\u7684\\u90e8\\u7f72\\uff0c\\u8ba9\\u4f60\\u7684\\u7f51\\u7ad9\\u65e0\\u7f1d\\u8fc1\\u79fb\\uff0c\\u5185\\u7f6e\\u5df2\\u7ecf\\u652f\\u6301SAE\\u3001BAE\\uff0c\\u6b63\\u5f0f\\u7248\\u5c06\\u5bf9\\u4e91\\u7aef\\u90e8\\u7f72\\u8fdb\\u884c\\u8fdb\\u4e00\\u6b65\\u4f18\\u5316\\u3002\"},{\"title\":\"\\u5b89\\u5168\\u7b56\\u7565\",\"icon\":\"heart\",\"content\":\"\\u63d0\\u4f9b\\u7684\\u7a33\\u5065\\u7684\\u5b89\\u5168\\u7b56\\u7565\\uff0c\\u5305\\u62ec\\u5907\\u4efd\\u6062\\u590d\\uff0c\\u5bb9\\u9519\\uff0c\\u9632\\u6cbb\\u6076\\u610f\\u653b\\u51fb\\u767b\\u9646\\uff0c\\u7f51\\u9875\\u9632\\u7be1\\u6539\\u7b49\\u591a\\u9879\\u5b89\\u5168\\u7ba1\\u7406\\u529f\\u80fd\\uff0c\\u4fdd\\u8bc1\\u7cfb\\u7edf\\u5b89\\u5168\\uff0c\\u53ef\\u9760\\uff0c\\u7a33\\u5b9a\\u7684\\u8fd0\\u884c\\u3002\"},{\"title\":\"\\u5e94\\u7528\\u6a21\\u5757\\u5316\",\"icon\":\"cubes\",\"content\":\"\\u63d0\\u51fa\\u5168\\u65b0\\u7684\\u5e94\\u7528\\u6a21\\u5f0f\\u8fdb\\u884c\\u6269\\u5c55\\uff0c\\u4e0d\\u7ba1\\u662f\\u4f60\\u5f00\\u53d1\\u4e00\\u4e2a\\u5c0f\\u529f\\u80fd\\u8fd8\\u662f\\u4e00\\u4e2a\\u5168\\u65b0\\u7684\\u7ad9\\u70b9\\uff0c\\u5728ThinkCMF\\u4e2d\\u4f60\\u53ea\\u662f\\u589e\\u52a0\\u4e86\\u4e00\\u4e2aAPP\\uff0c\\u6bcf\\u4e2a\\u72ec\\u7acb\\u8fd0\\u884c\\u4e92\\u4e0d\\u5f71\\u54cd\\uff0c\\u4fbf\\u4e8e\\u7075\\u6d3b\\u6269\\u5c55\\u548c\\u4e8c\\u6b21\\u5f00\\u53d1\\u3002\"},{\"title\":\"\\u514d\\u8d39\\u5f00\\u6e90\",\"icon\":\"certificate\",\"content\":\"\\u4ee3\\u7801\\u9075\\u5faaApache2\\u5f00\\u6e90\\u534f\\u8bae\\uff0c\\u514d\\u8d39\\u4f7f\\u7528\\uff0c\\u5bf9\\u5546\\u4e1a\\u7528\\u6237\\u4e5f\\u65e0\\u4efb\\u4f55\\u9650\\u5236\\u3002\"}]}},\"home_last_news_202206300003\":{\"title\":\"\\u6700\\u65b0\\u8d44\\u8baf\",\"name\":\"last_news\",\"display\":\"1\",\"version\":\"1.0.0\",\"action\":\"\",\"vars\":{\"last_news_category_id\":\"\"}},\"home_last_news_202206300004\":{\"title\":\"\\u6700\\u65b0\\u8d44\\u8baf\",\"name\":\"last_news\",\"display\":\"1\",\"version\":\"1.0.0\",\"action\":\"\",\"vars\":{\"last_news_category_id\":\"\"}}}},\"footer\":{\"title\":\"\\u5e95\\u90e8\",\"widgets\":{\"home_footer_202206300003\":{\"title\":\"\\u5e95\\u90e8\",\"name\":\"footer\",\"display\":\"1\",\"public_widget_id\":\"footer\",\"version\":\"1.0.0\",\"action\":\"\",\"vars\":[]}}}}}' , `config_more` = '{\"widgets_blocks\":{\"top\":{\"title\":\"\\u9876\\u90e8\",\"widgets\":{\"top_nav_202206300003\":{\"title\":\"\\u9876\\u90e8\\u5bfc\\u822a\",\"name\":\"nav\",\"display\":\"1\",\"public_widget_id\":\"top_nav\"}}},\"body\":{\"title\":\"\\u4e3b\\u4f53\",\"widgets\":{\"home_slider_202206300003\":{\"title\":\"\\u9996\\u9875\\u5e7b\\u706f\\u7247\",\"name\":\"slider\",\"display\":\"1\"},\"home_features_202206300003\":{\"title\":\"\\u4ea7\\u54c1\\u7279\\u6027\",\"name\":\"features\",\"display\":\"1\"},\"home_last_news_202206300003\":{\"title\":\"\\u6700\\u65b0\\u8d44\\u8baf\",\"name\":\"last_news\",\"display\":\"1\"},\"home_last_news_202206300004\":{\"title\":\"\\u6700\\u65b0\\u8d44\\u8baf\",\"name\":\"last_news\",\"display\":\"1\"}}},\"footer\":{\"title\":\"\\u5e95\\u90e8\",\"widgets\":{\"home_footer_202206300003\":{\"title\":\"\\u5e95\\u90e8\",\"name\":\"footer\",\"display\":\"1\",\"public_widget_id\":\"footer\"}}}}}' , `description` = '首页模板文件' , `is_public` = 0 , `list_order` = '5' WHERE `theme` = 'default' AND `file` = 'portal/search' [ RunTime:0.003530s ]
- SELECT * FROM `cmf_theme_file` WHERE `theme` = 'default' AND `file` = 'portal/smart' LIMIT 1 [ RunTime:0.000351s ]
- UPDATE `cmf_theme_file` SET `theme` = 'default' , `action` = 'portal/Index/index' , `file` = 'portal/smart' , `name` = '首页' , `more` = '{\"widgets_blocks\":{\"top\":{\"title\":\"\\u9876\\u90e8\",\"widgets\":{\"top_nav_202206300003\":{\"title\":\"\\u9876\\u90e8\\u5bfc\\u822a\",\"name\":\"nav\",\"display\":\"1\",\"public_widget_id\":\"top_nav\",\"version\":\"1.0.0\",\"action\":\"\",\"vars\":{\"company_name\":\"ThinkCMF\",\"nav_id\":\"\"}}}},\"body\":{\"title\":\"\\u4e3b\\u4f53\",\"widgets\":{\"home_slider_202206300003\":{\"title\":\"name\",\"name\":\"slider\",\"display\":1,\"version\":\"1.0.0\",\"action\":\"\",\"vars\":{\"slide_id\":31,\"fullscreen\":1},\"css\":{\"margin-top\":0,\"margin-bottom\":0,\"margin-left\":0,\"margin-right\":0}}}},\"footer\":{\"title\":\"\\u5e95\\u90e8\",\"widgets\":{\"home_footer_202206300003\":{\"title\":\"\\u5e95\\u90e8\",\"name\":\"footer\",\"display\":\"1\",\"public_widget_id\":\"footer\",\"version\":\"1.0.0\",\"action\":\"\",\"vars\":{\"company_name\":\"ThinkCMF\",\"nav_id\":\"2\"}}}}}}' , `config_more` = '{\"widgets_blocks\":{\"top\":{\"title\":\"\\u9876\\u90e8\",\"widgets\":{\"top_nav_202206300003\":{\"title\":\"\\u9876\\u90e8\\u5bfc\\u822a\",\"name\":\"nav\",\"display\":\"1\",\"public_widget_id\":\"top_nav\"}}},\"body\":{\"title\":\"\\u4e3b\\u4f53\",\"widgets\":{\"home_slider_202206300003\":{\"title\":\"name\",\"name\":\"slider\",\"display\":1,\"version\":\"1.0.0\",\"action\":\"\",\"vars\":{\"slide_id\":31,\"fullscreen\":1},\"css\":{\"margin-top\":0,\"margin-bottom\":0,\"margin-left\":0,\"margin-right\":0}}}},\"footer\":{\"title\":\"\\u5e95\\u90e8\",\"widgets\":{\"home_footer_202206300003\":{\"title\":\"\\u5e95\\u90e8\",\"name\":\"footer\",\"display\":\"1\",\"public_widget_id\":\"footer\"}}}}}' , `description` = '首页模板文件' , `is_public` = 0 , `list_order` = '5' WHERE `theme` = 'default' AND `file` = 'portal/smart' [ RunTime:0.003048s ]
- SELECT * FROM `cmf_theme_file` WHERE `theme` = 'default' AND `file` = 'public/config' LIMIT 1 [ RunTime:0.000256s ]
- UPDATE `cmf_theme_file` SET `theme` = 'default' , `action` = 'public/Config' , `file` = 'public/config' , `name` = '模板全局配置' , `more` = '{\"vars\":{\"enable_mobile\":{\"title\":\"\\u624b\\u673a\\u6ce8\\u518c\",\"type\":\"select\",\"value\":1,\"options\":{\"1\":\"\\u5f00\\u542f\",\"0\":\"\\u5173\\u95ed\"},\"tip\":\"\"}},\"widgets_blocks\":{\"public\":{\"title\":\"\\u5168\\u5c40\",\"widgets\":{\"top_nav\":{\"title\":\"\\u9876\\u90e8\\u5bfc\\u822a\",\"name\":\"nav\",\"display\":1,\"version\":\"1.0.0\",\"action\":\"\",\"vars\":{\"company_name\":\"ThinkCMF\",\"nav_id\":\"1\"},\"css\":{\"margin-top\":\"0\",\"margin-bottom\":\"15px\",\"margin-left\":\"0\",\"margin-right\":\"0\"}},\"footer\":{\"title\":\"\\u5e95\\u90e8\",\"name\":\"footer\",\"display\":1,\"version\":\"1.0.0\",\"action\":\"\",\"vars\":[],\"css\":{\"margin-top\":\"0\",\"margin-bottom\":\"15px\",\"margin-left\":\"0\",\"margin-right\":\"0\"}}}}}}' , `config_more` = '{\"vars\":{\"enable_mobile\":{\"title\":\"\\u624b\\u673a\\u6ce8\\u518c\",\"type\":\"select\",\"value\":1,\"options\":{\"1\":\"\\u5f00\\u542f\",\"0\":\"\\u5173\\u95ed\"},\"tip\":\"\"}},\"widgets_blocks\":{\"public\":{\"title\":\"\\u5168\\u5c40\",\"widgets\":{\"top_nav\":{\"title\":\"\\u9876\\u90e8\\u5bfc\\u822a\",\"name\":\"nav\",\"display\":\"1\"},\"footer\":{\"title\":\"\\u5e95\\u90e8\",\"name\":\"footer\",\"display\":\"1\"}}}}}' , `description` = '模板全局配置文件' , `is_public` = 1 , `list_order` = '0' WHERE `theme` = 'default' AND `file` = 'public/config' [ RunTime:0.003115s ]
- SELECT * FROM `cmf_theme_file` WHERE `theme` = 'default' [ RunTime:0.000294s ]
- SHOW FULL COLUMNS FROM `cmf_theme` [ RunTime:0.001366s ]
- UPDATE `cmf_theme` SET `name` = 'default' , `version` = '8.0.0' , `demo_url` = 'http://demo.thinkcmf.com' , `author` = 'ThinkCMF' , `lang` = 'zh-cn' , `author_url` = 'http://www.thinkcmf.com' , `keywords` = 'ThinkCMF默认模板' , `description` = 'ThinkCMF默认模板' WHERE `theme` = 'default' [ RunTime:0.003207s ]
- SELECT `more`,`file`,`id`,`is_public` FROM `cmf_theme_file` WHERE `theme` = 'default' AND ( `is_public` = 1 OR `file` = 'portal/blog_detail' ) ORDER BY `is_public` DESC [ RunTime:0.000308s ]
- SHOW FULL COLUMNS FROM `cmf_nav_menu` [ RunTime:0.001414s ]
- SELECT * FROM `cmf_nav_menu` WHERE `nav_id` = 1 AND `status` = 1 ORDER BY `list_order` ASC [ RunTime:0.000736s ]
- SELECT * FROM `cmf_nav_menu` WHERE `nav_id` = 1 AND `status` = 1 ORDER BY `list_order` ASC [ RunTime:0.000714s ]
- SELECT * FROM `cmf_nav_menu` WHERE `nav_id` = 2 AND `status` = 1 ORDER BY `list_order` ASC [ RunTime:0.000465s ]
- SELECT * FROM `cmf_nav_menu` WHERE `nav_id` = 2 AND `status` = 1 ORDER BY `list_order` ASC [ RunTime:0.000378s ]

0.131117s

Overview
Maintaining optimal operating conditions for enterprise-grade ZTE routers is critical for network stability and hardware longevity. Environmental monitoring, specifically tracking hardware temperature and fan speed, allows network engineers to prevent overheating and avoid unplanned downtime. This FAQ provides expert-level answers on how to access this vital telemetry data using command-line interfaces (CLI) and Simple Network Management Protocol (SNMP), ensuring your critical routing infrastructure remains within safe operational parameters. ZTE equipment features distributed temperature collection and advanced thermal management, including automatic fan speed adjustments for energy-efficient cooling .
Frequently Asked Questions